Analytics Interface
- Log in to Free App Analytics.
- Select the desired Account and App.
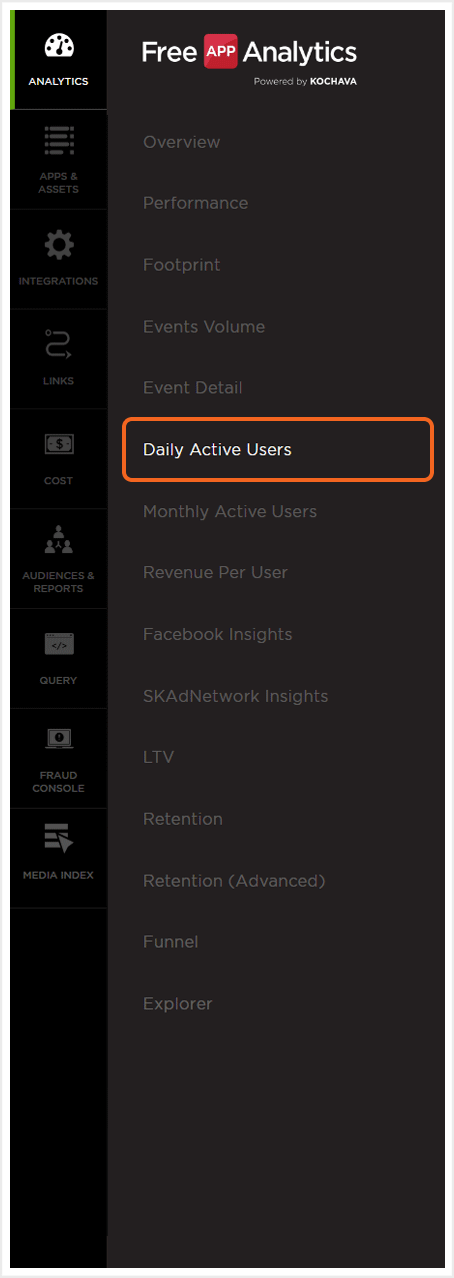
- Select Analytics > Daily Active Users.
Analytics Page Tools
For more information on the tools available for this Analytic Page such as the date field, exporting device IDs, sharing the page and applying Cohorts and filters, refer to our Analytics Page Tools support documentation.
Daily Active Users Overview
By default when the Daily Active Users page is displayed, Active Users and RPU are displayed.
NOTE: When leveraging Cross App functionality, Daily Active User data for all apps within the App Name filter will be displayed. For more information about adding apps using the filter feature, refer to our Analytics Page Tools support documentation.
NOTE: In order to visualize these high volumes of data quickly, Kochava utilizes HLL to rapidly analyze unique Kochava Device IDs across all events.
NOTE: In order to display the Total Revenue and/or the Purchase Events, click the desired metric(s).
Active Users daily totals are accounted for on the vertical axis and are represented by the blue bars.
Revenue Per User totals are accounted for on the vertical axis and are represented by the orange line.
NOTE: By default, Total Revenue and Purchase Events are deactivated.
Total Revenue are accounted for on the vertical axis and are represented by the yellow line.
Purchase Events are accounted for on the vertical axis and are represented by the green line.
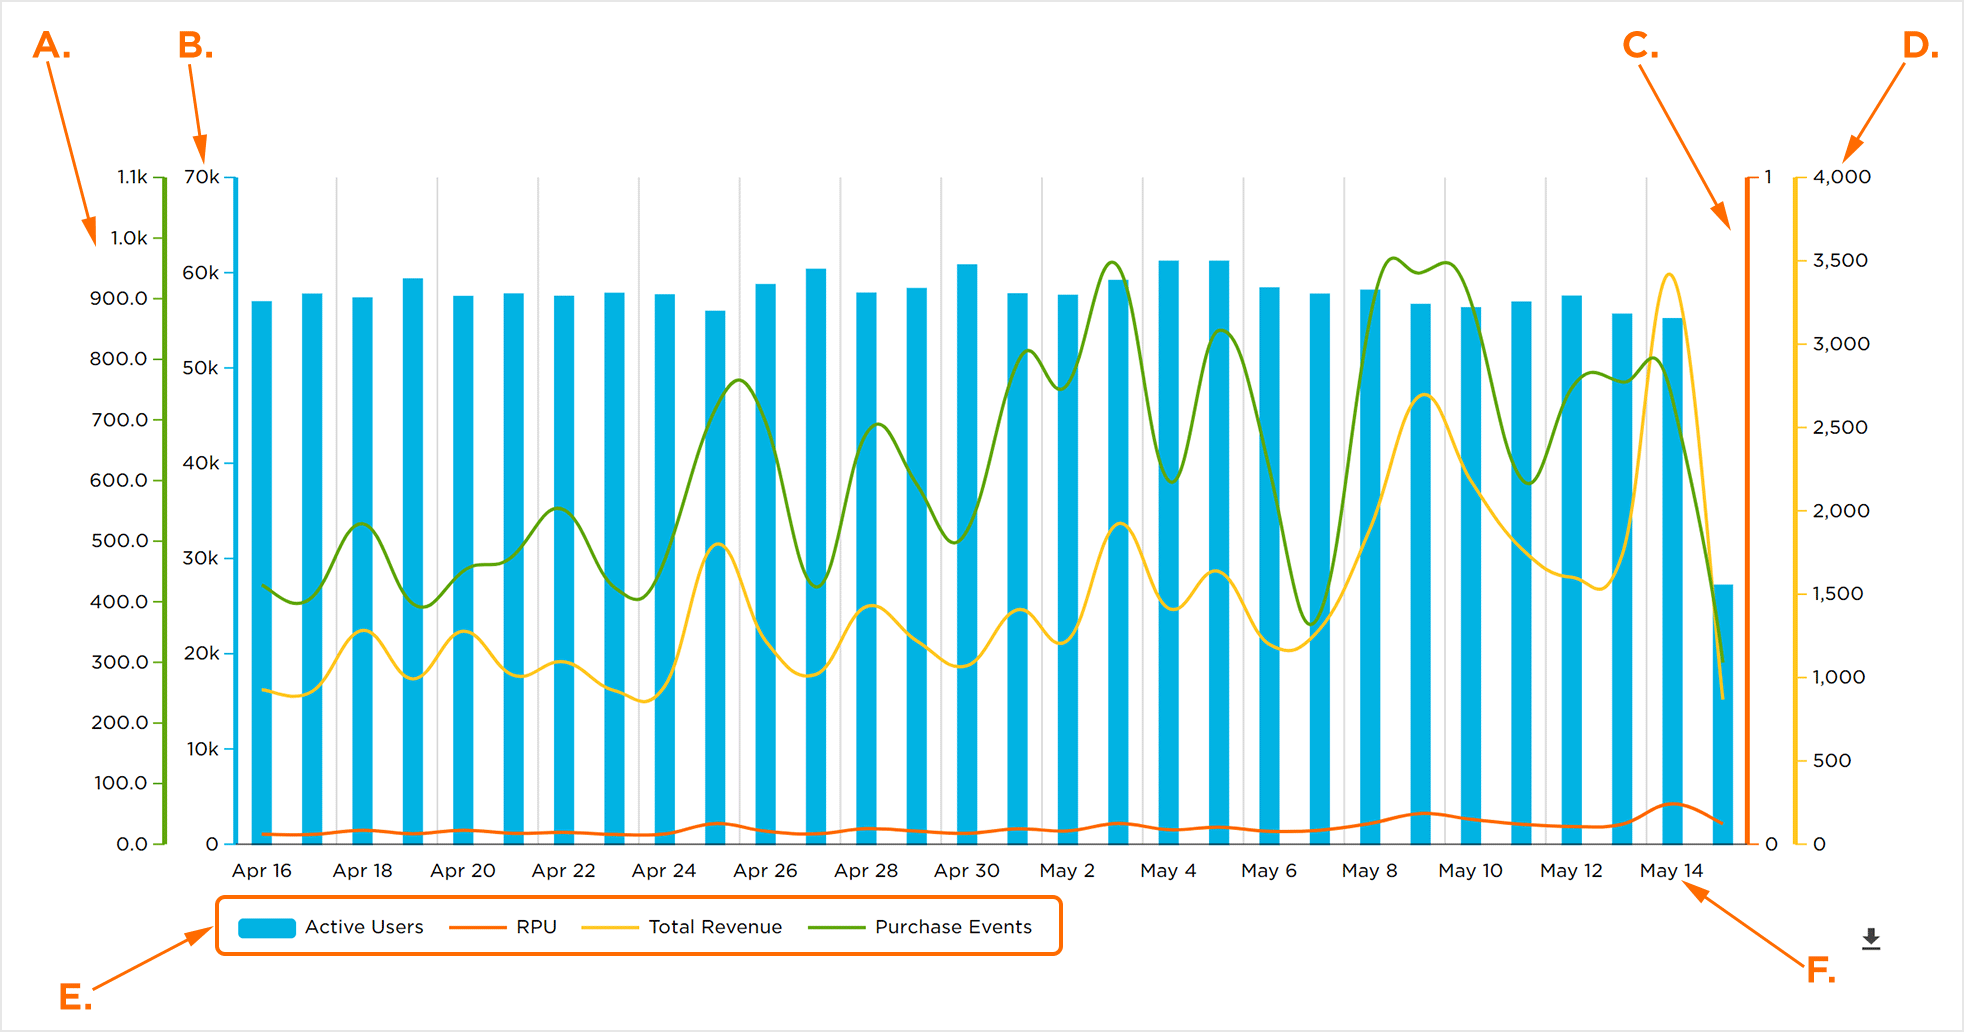
A. Purchase Events vertical axis.
B. Active Users vertical axis
C. Revenue Per User vertical axis
D. Total Revenue vertical axis.
E. Data being displayed. Click to activate/deactivate
F. Timeframe horizontal axis
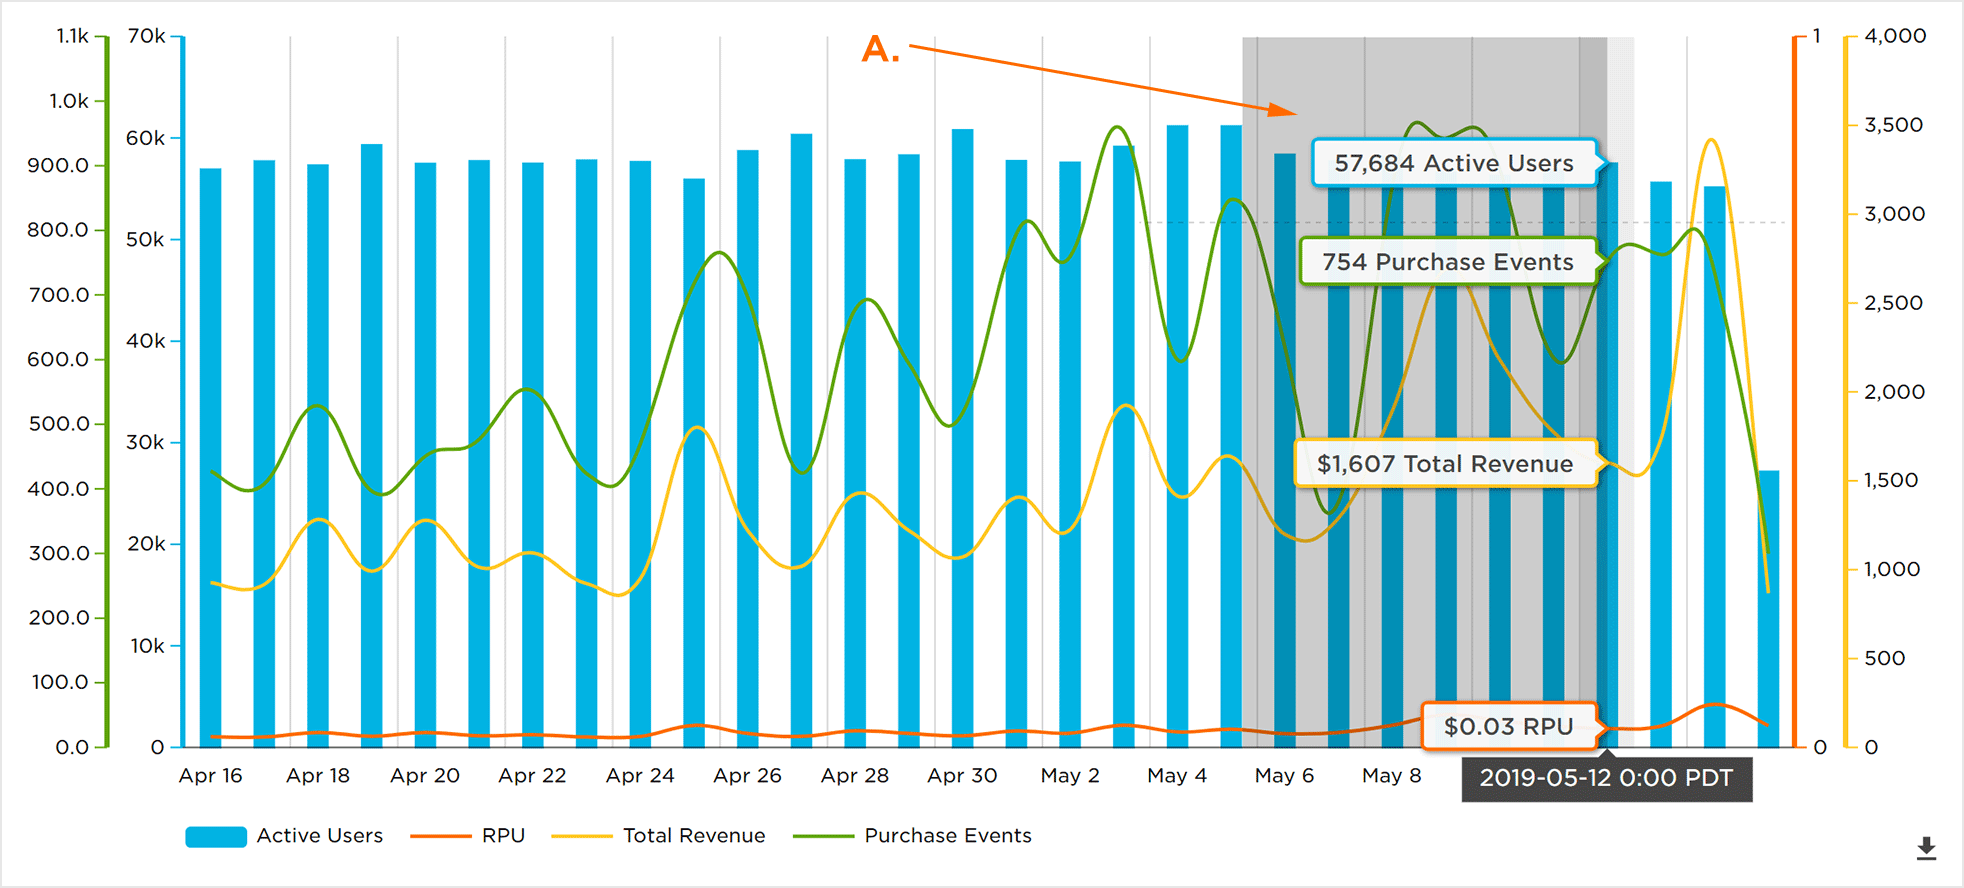
Mousing over the Daily Active Users chart will display the data for the corresponding day. Each metric will be displayed in a color coordinated box over the selected day.
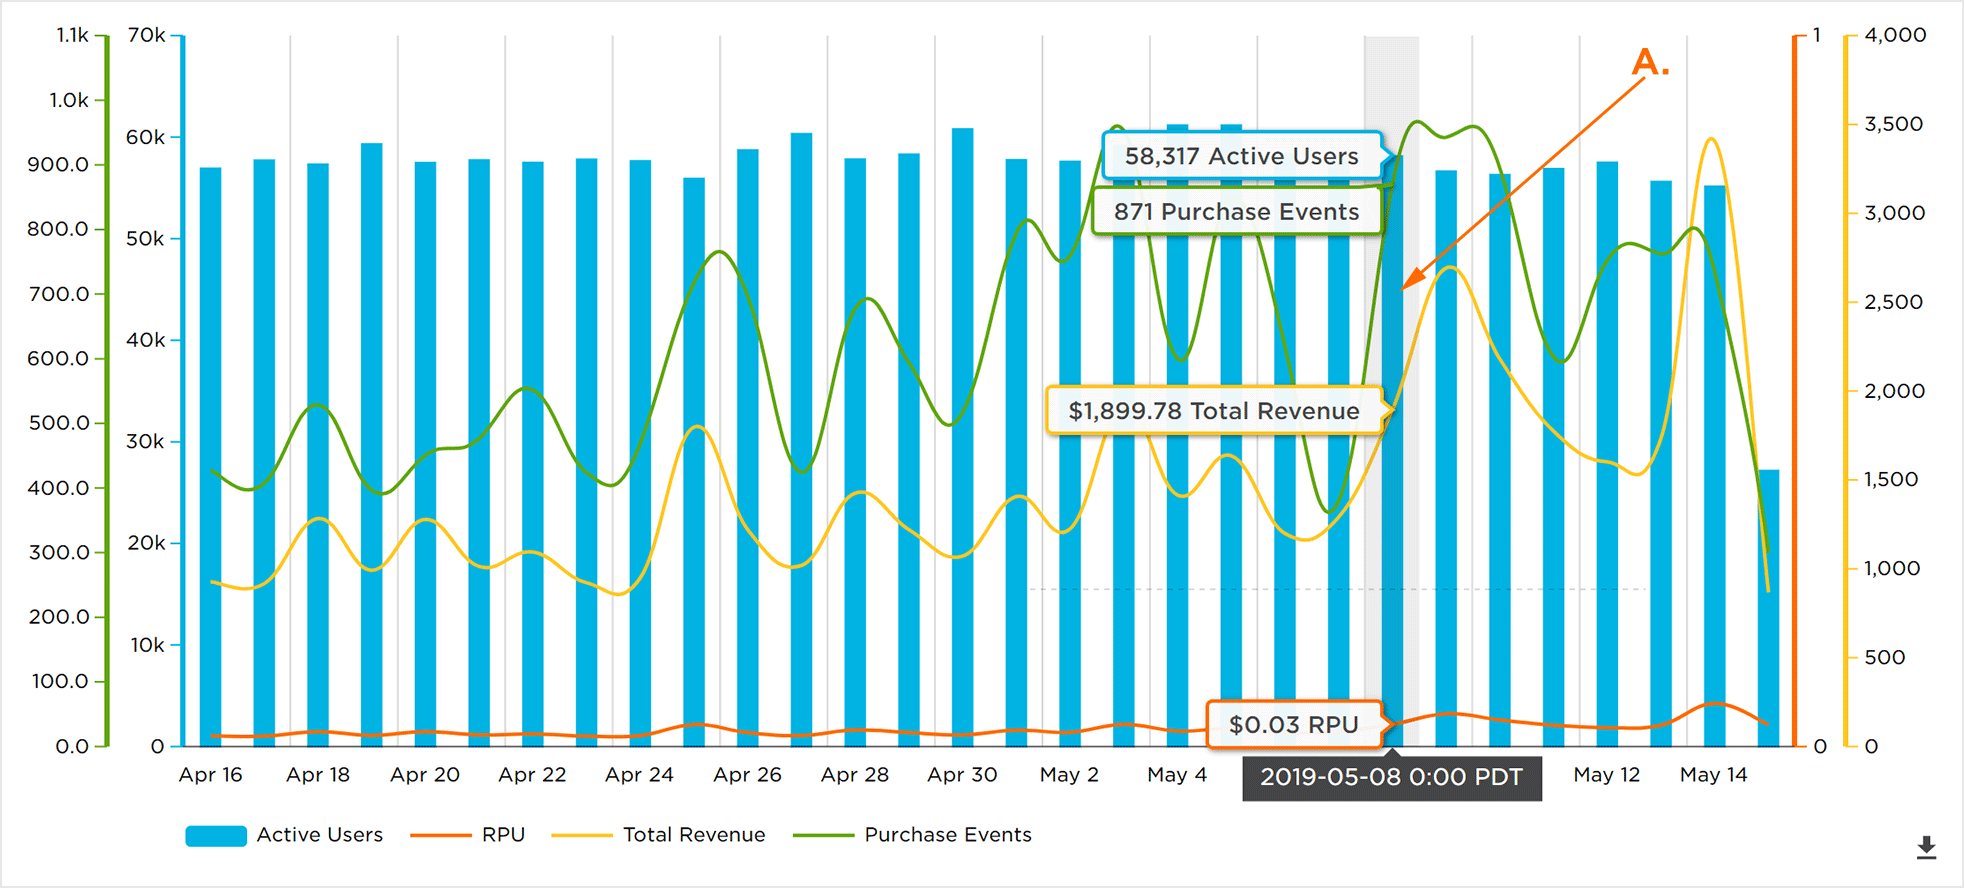
A. Mouseover date to display data
Refine Specific Date Range
Refine Date Range:
The data for a specific date range can be viewed in further detail.
- Click and hold on the start date.
- Drag to the end date and release.
A. Click, hold and drag over date range
The selected date range is now displayed. Specific data for each day within the refined date range can be viewed by mousing over the date.
NOTE: The date range can be refined down to two days.
Return to Full Graph:
In order to return to the full graph, Click –.
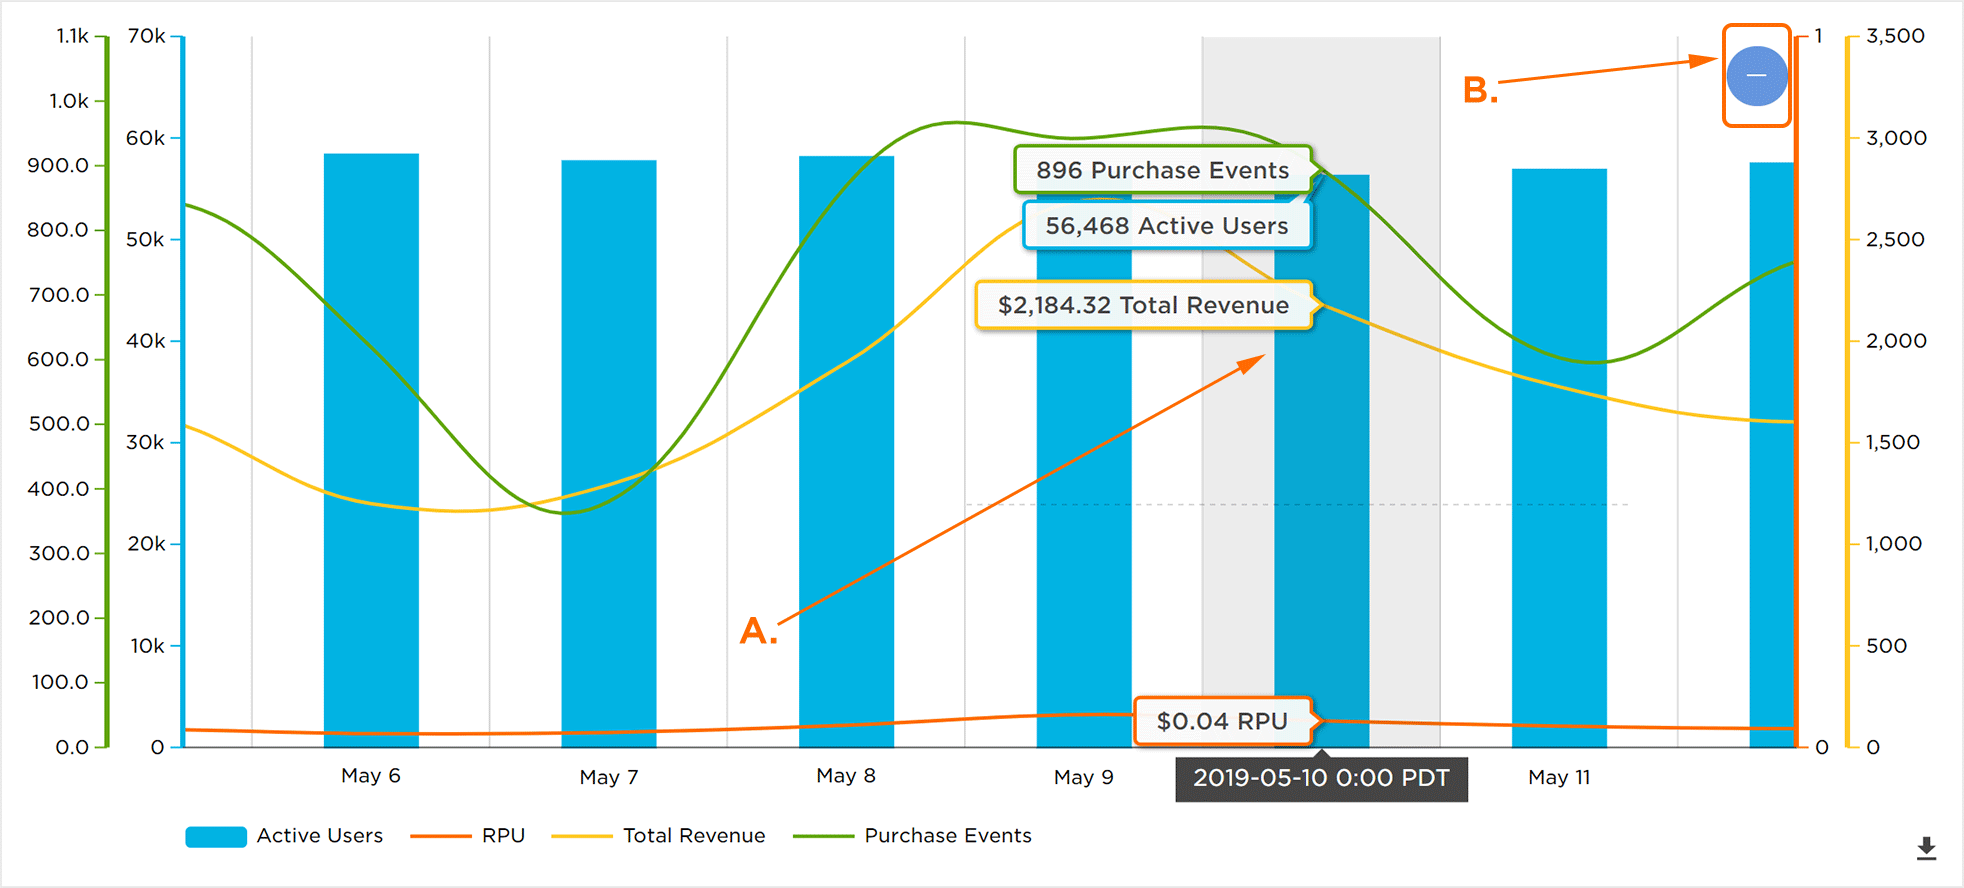
A. Mouseover to view date specific data
B. Click to return to original date range
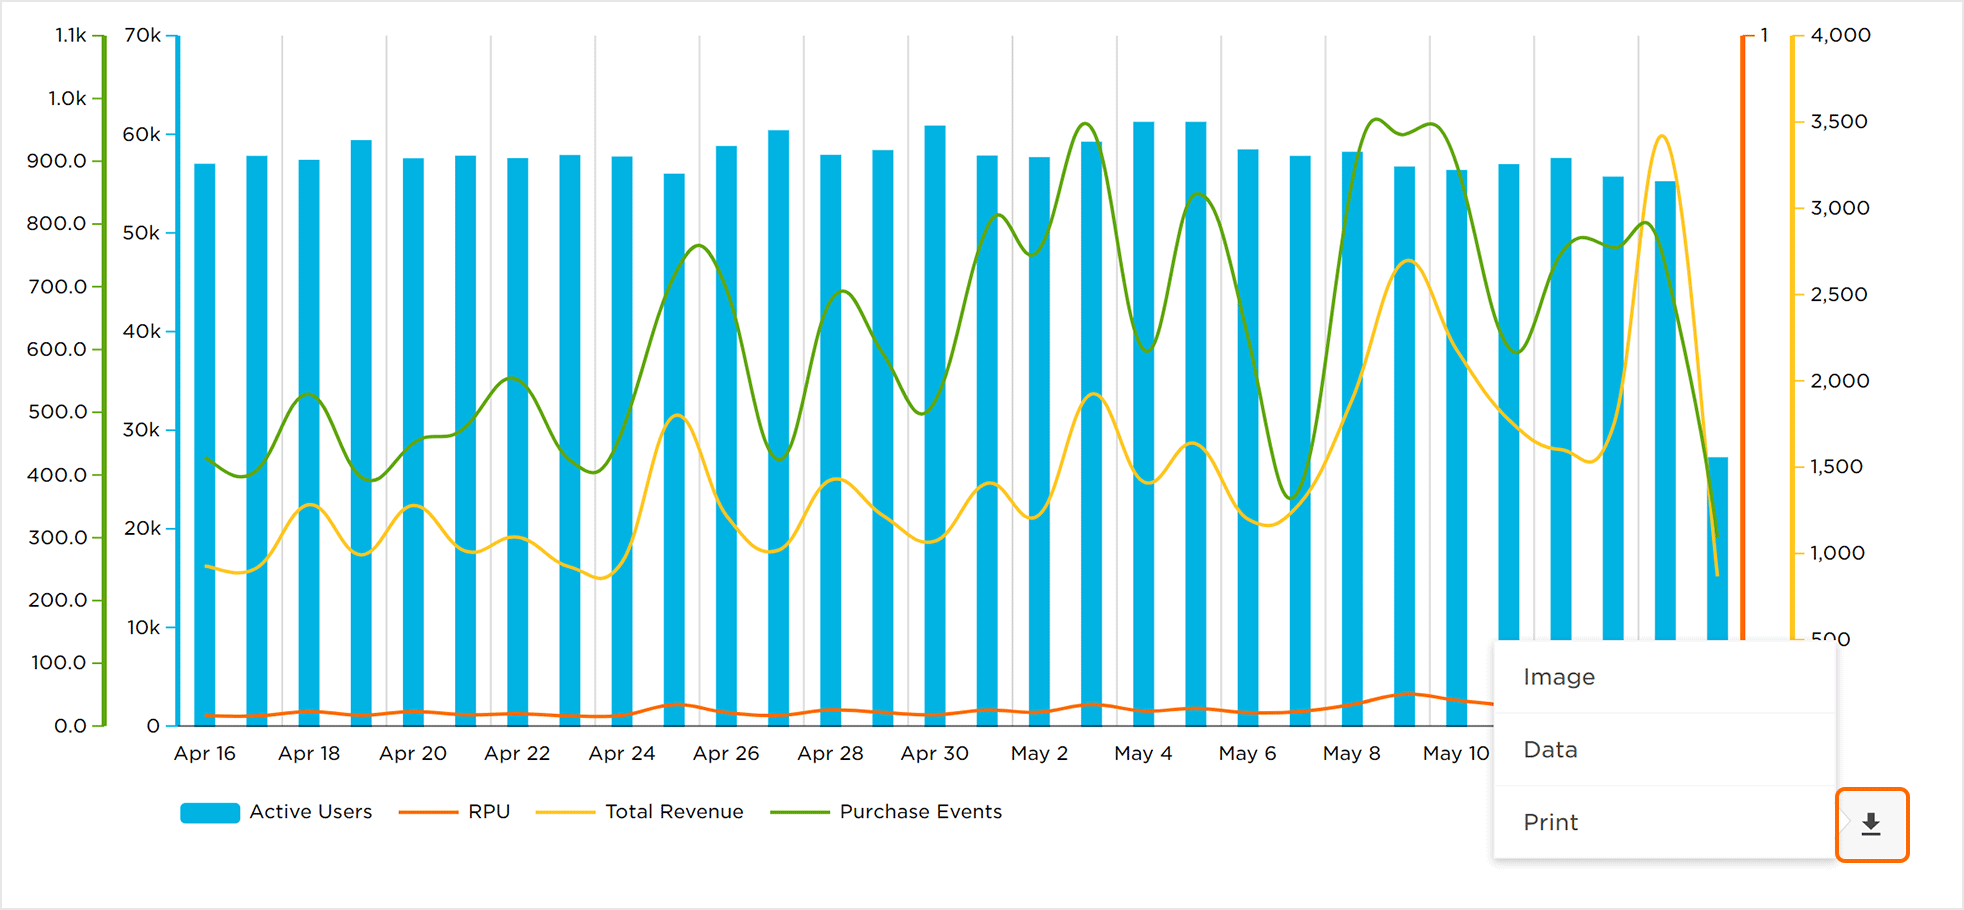
Downloading the Daily Active Users Data
The data displayed within the Daily Active Users chart can be downloaded in several different formats.
Export Graphically:
Select the Download Button > Download Chart Image:
- PNG
- JPG
- SVG
Download Chart Data:
Select the Download Button > Download Data:
- CSV
Print Data:
Select the Download Button > Print.