Analytics Interface
- Log in to Free App Analytics.
- Select the desired Account and App.
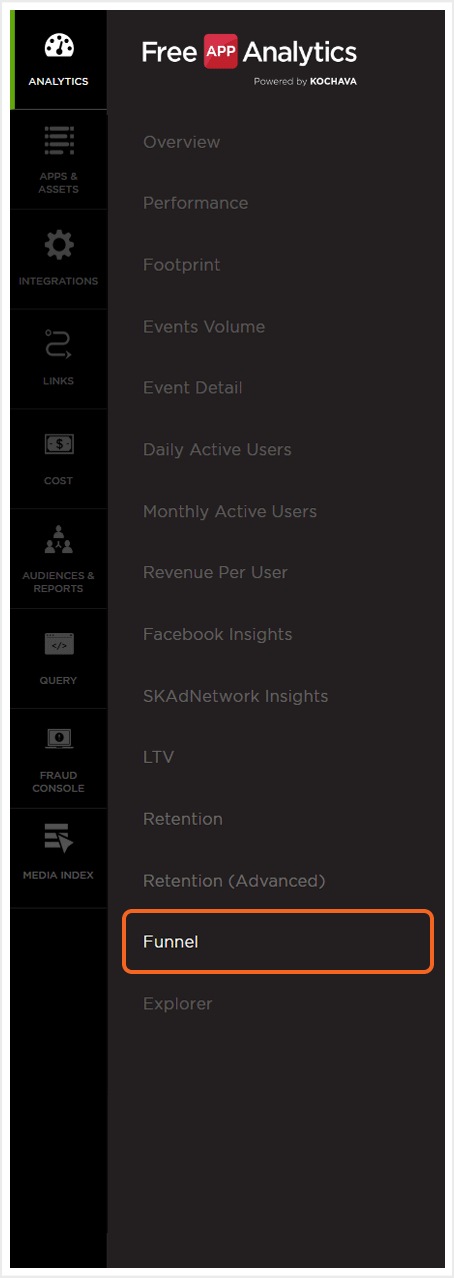
- Select Analytics > Funnel.
Analytics Page Tools
For more information on the tools available for this Analytic Page such as the date field, exporting audiences, sharing the page and applying Cohorts and filters, refer to our Analytics Page Tools support documentation.
Funnel Overview
Think of the Funnel tool within Kochava as an actual funnel. The first event selected will serve as a starting point by which all subsequent events will be measured. Events should be selected to follow the “user paths” through the app.
Events are displayed on the left in descending order. The Event Totals, Percentage of previous event, Percentage of users lost from funnel and the Percentage of users still within the funnel are displayed on the right.
NOTE: When leveraging Cross App functionality, the event data that is consistent between each app of the App Name filter will be displayed within the Funnel. For more information about adding apps using the filter feature, refer to our Analytics Page Tools support documentation.
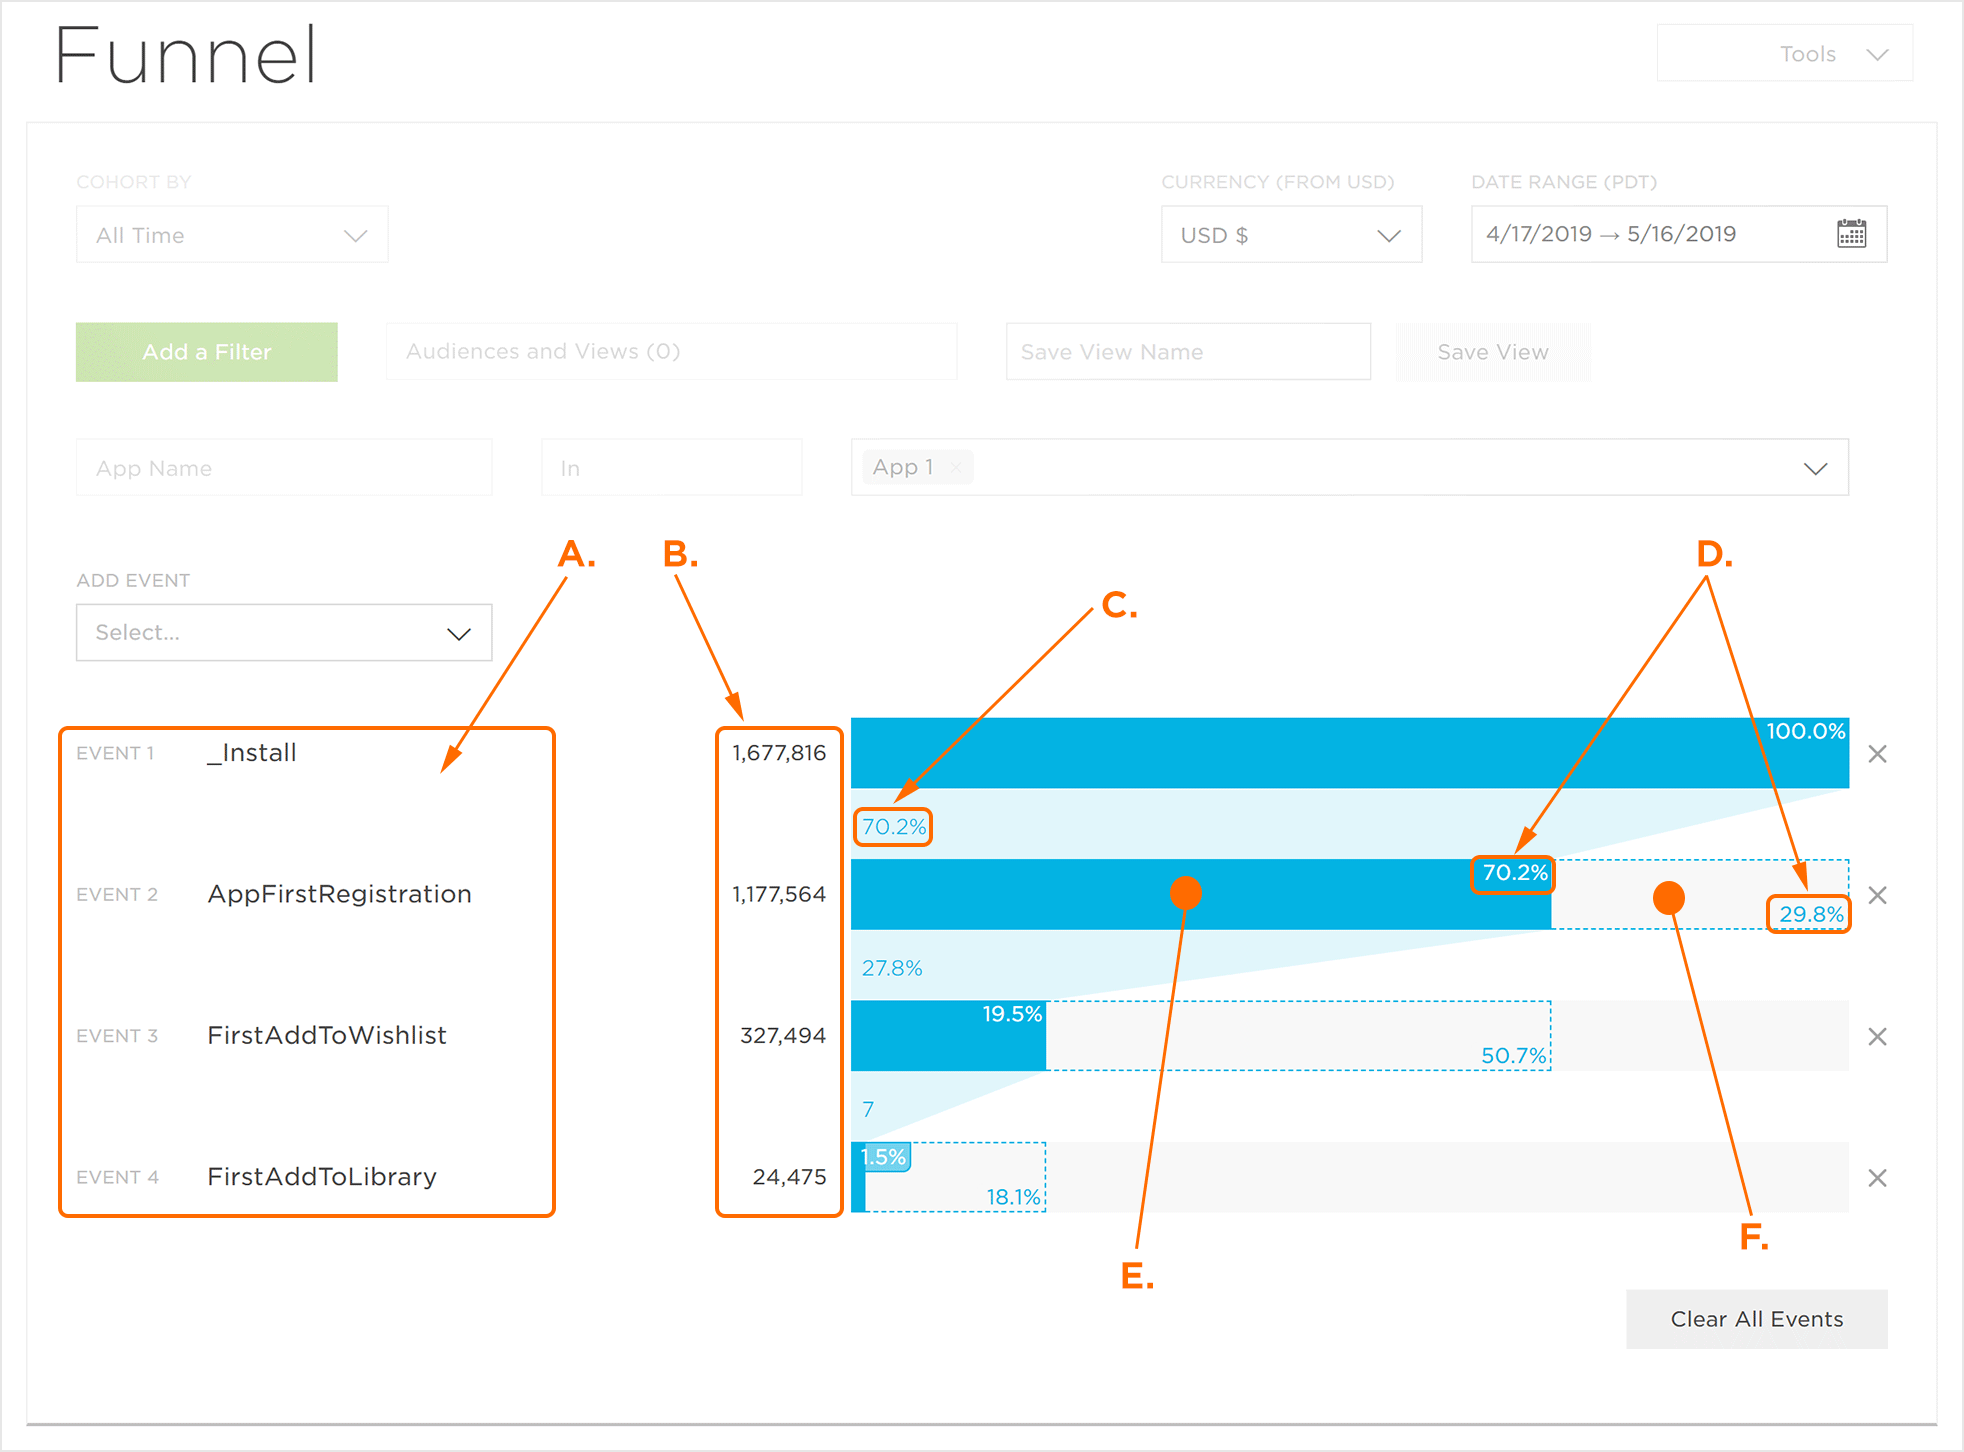
A. Selected Events
B. Unique Users
C. Funnel Percentage of Previous Events
D. Category Percentage
E. Users in Funnel
F. Users Lost from Funnel
Adding Events to the Funnel
By default, no events are active when the Analytics Funnel is initially loaded.
NOTE: When leveraging Cross App functionality, only the events that are consistent between each app of the App Name filter are eligible to be displayed within the Funnel. For more information about adding apps using the filter feature, refer to our Analytics Page Tools support documentation.
- From the Add Event drop-down menu, Select the desired initial event.
- From the Add Event drop-down menu, Select any additional desired event.
- Repeat Step 2 as needed until all desired events are added.
NOTE: Once the first event is added, a graphical representation of the event quantity and percentage will be generated. The initial event will always display a percentage value of 100%, and every subsequent event will be based upon its relationship to the initial event.
NOTE: In order to visualize high volumes of data quickly, Kochava utilizes [itg-glossary glossary-id=”4131″]Theta Sketches[/itg-glossary] which are based off unique users as the basis for Funnel visualization. For precise numbers use the Explorer tool.
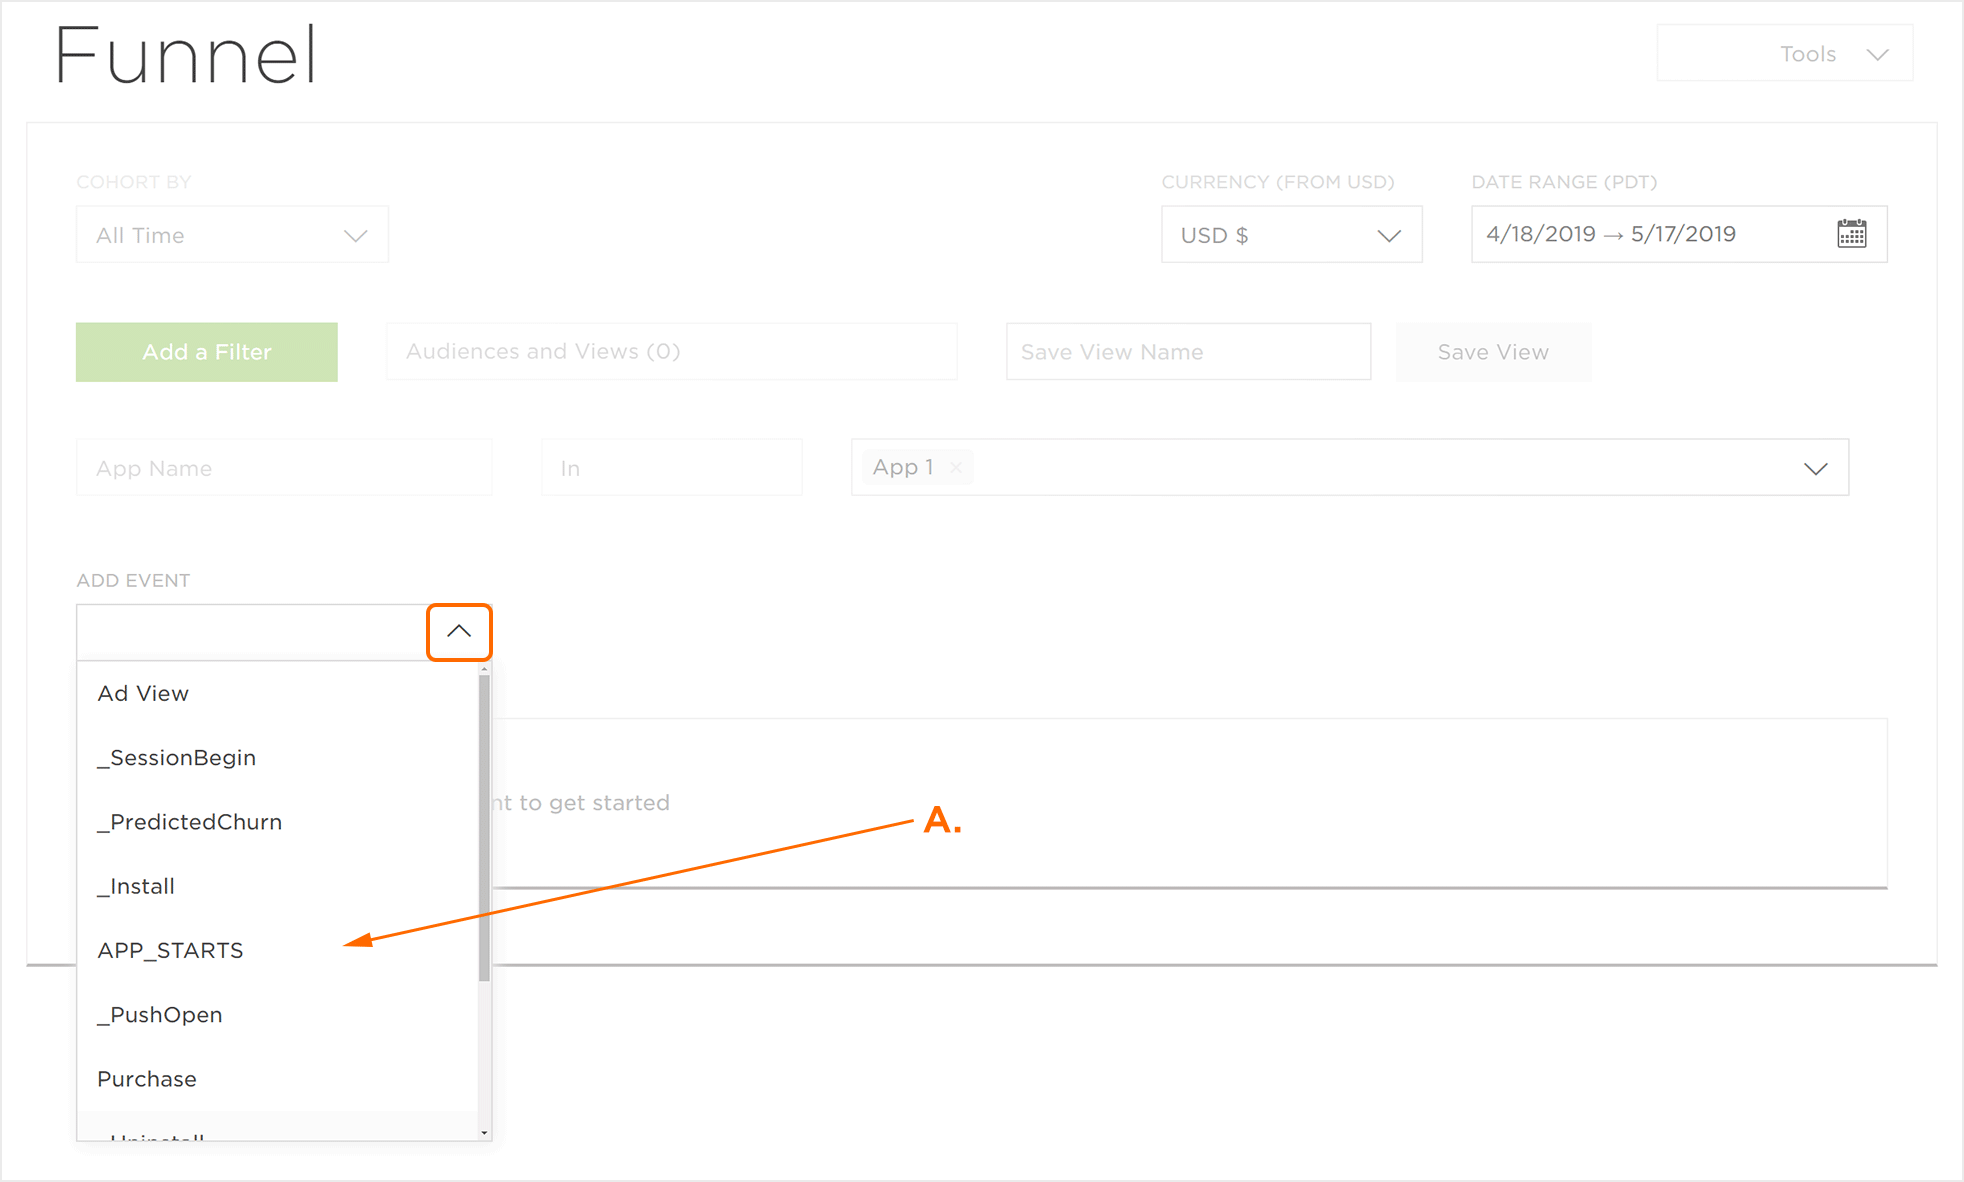
A. Select the desired initial event
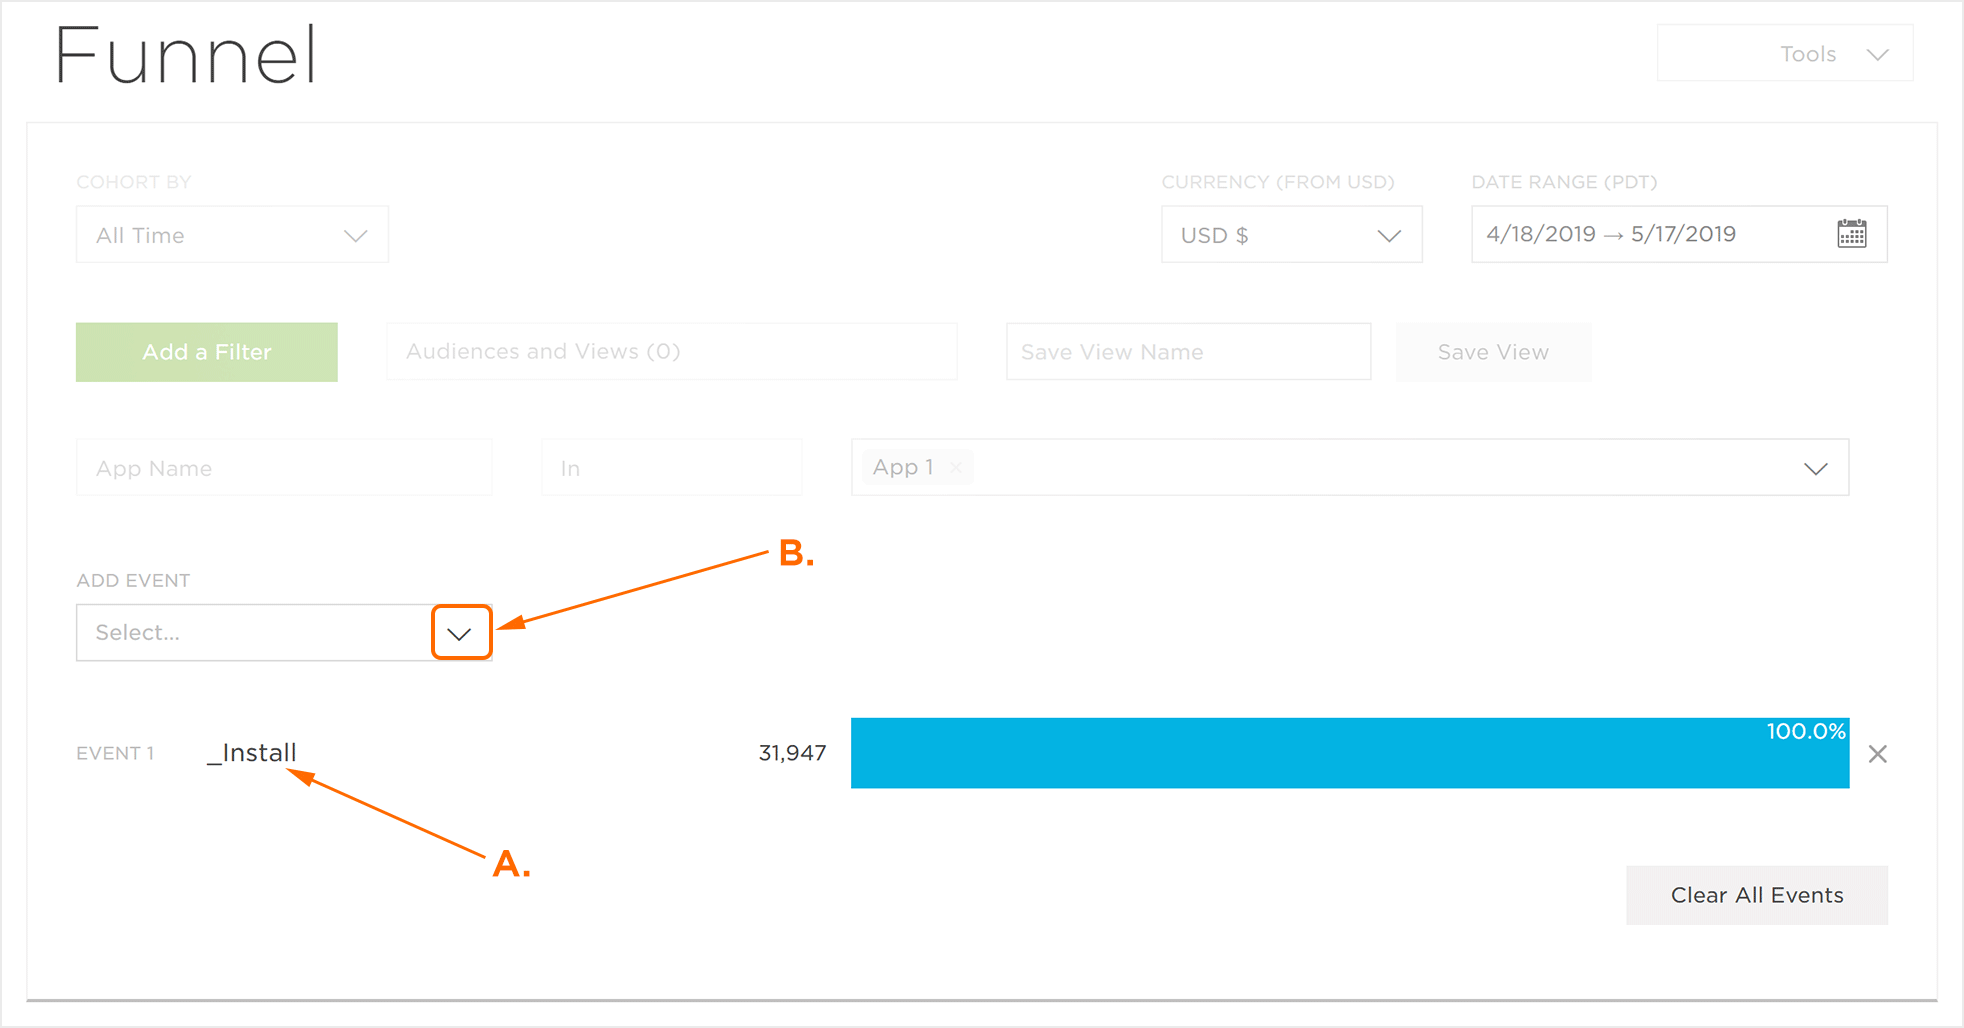
A. Initially selected event
B. Click to add additional Events
Removing Events from the Funnel
Removing events from the Funnel can be accomplished in one of the following ways:
- To remove one event at a time, Click on the “X” next to the event you want to remove.
- To clear all events Click Clear All Events.
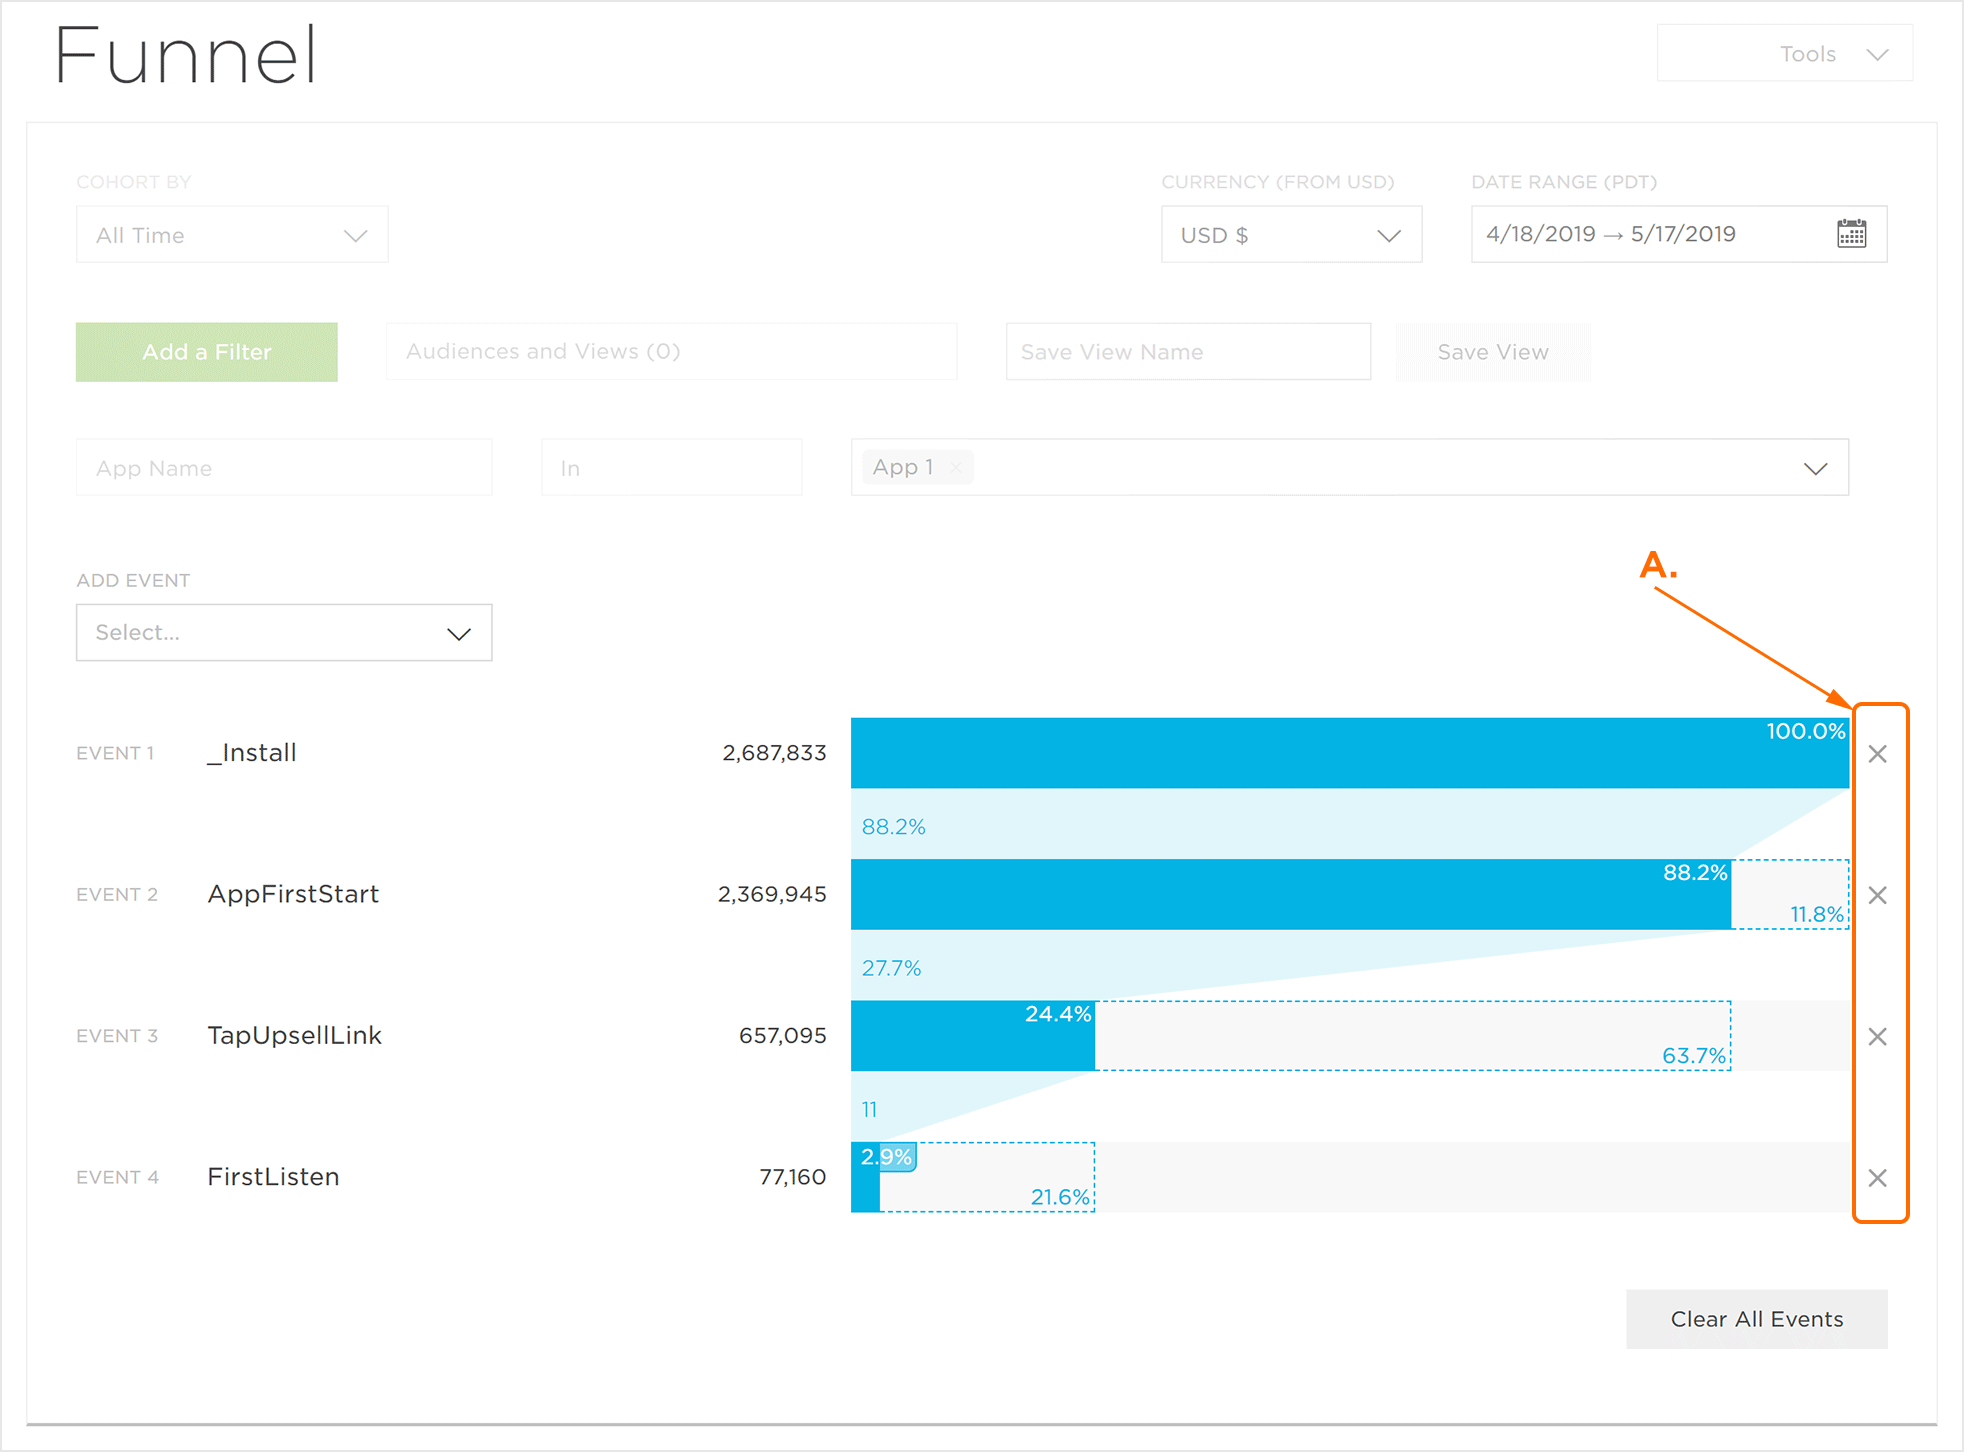
A. Click on the “X” to remove a single event
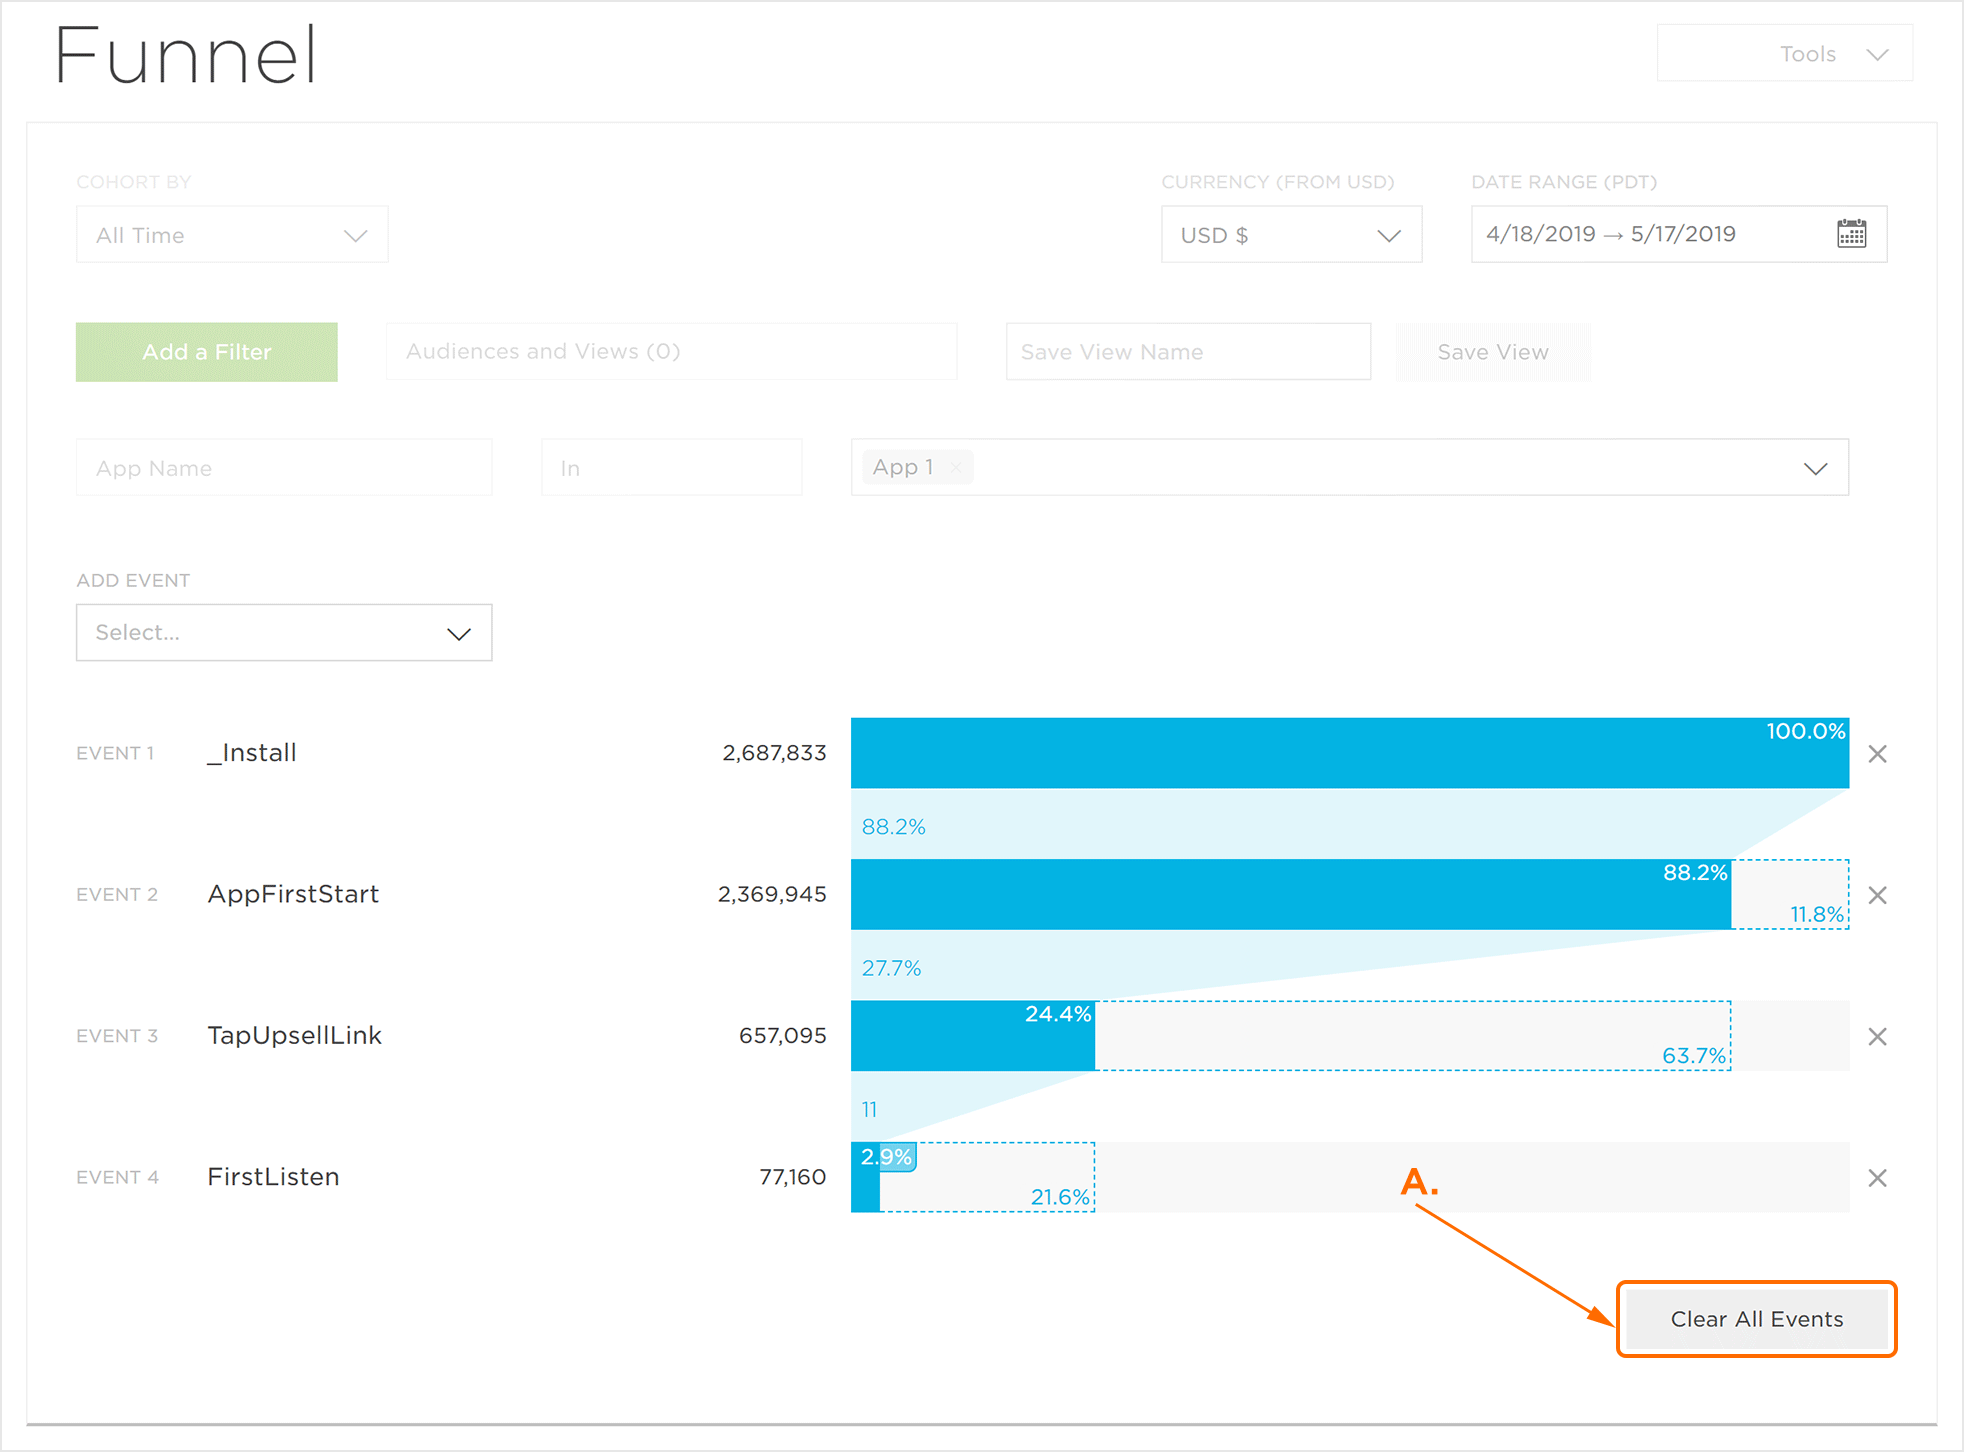
A. Click to clear all events
Explore the Funnel
The Funnel events can be further analyzed through the use of the Explorer page.
- Determine the Event to explore.
- Click on the blue section (users who met the criteria) or the light-grey section (users who fell outside the criteria):
- Event > Devices in Funnel > Explore
- Event > Lost from Funnel > Explore
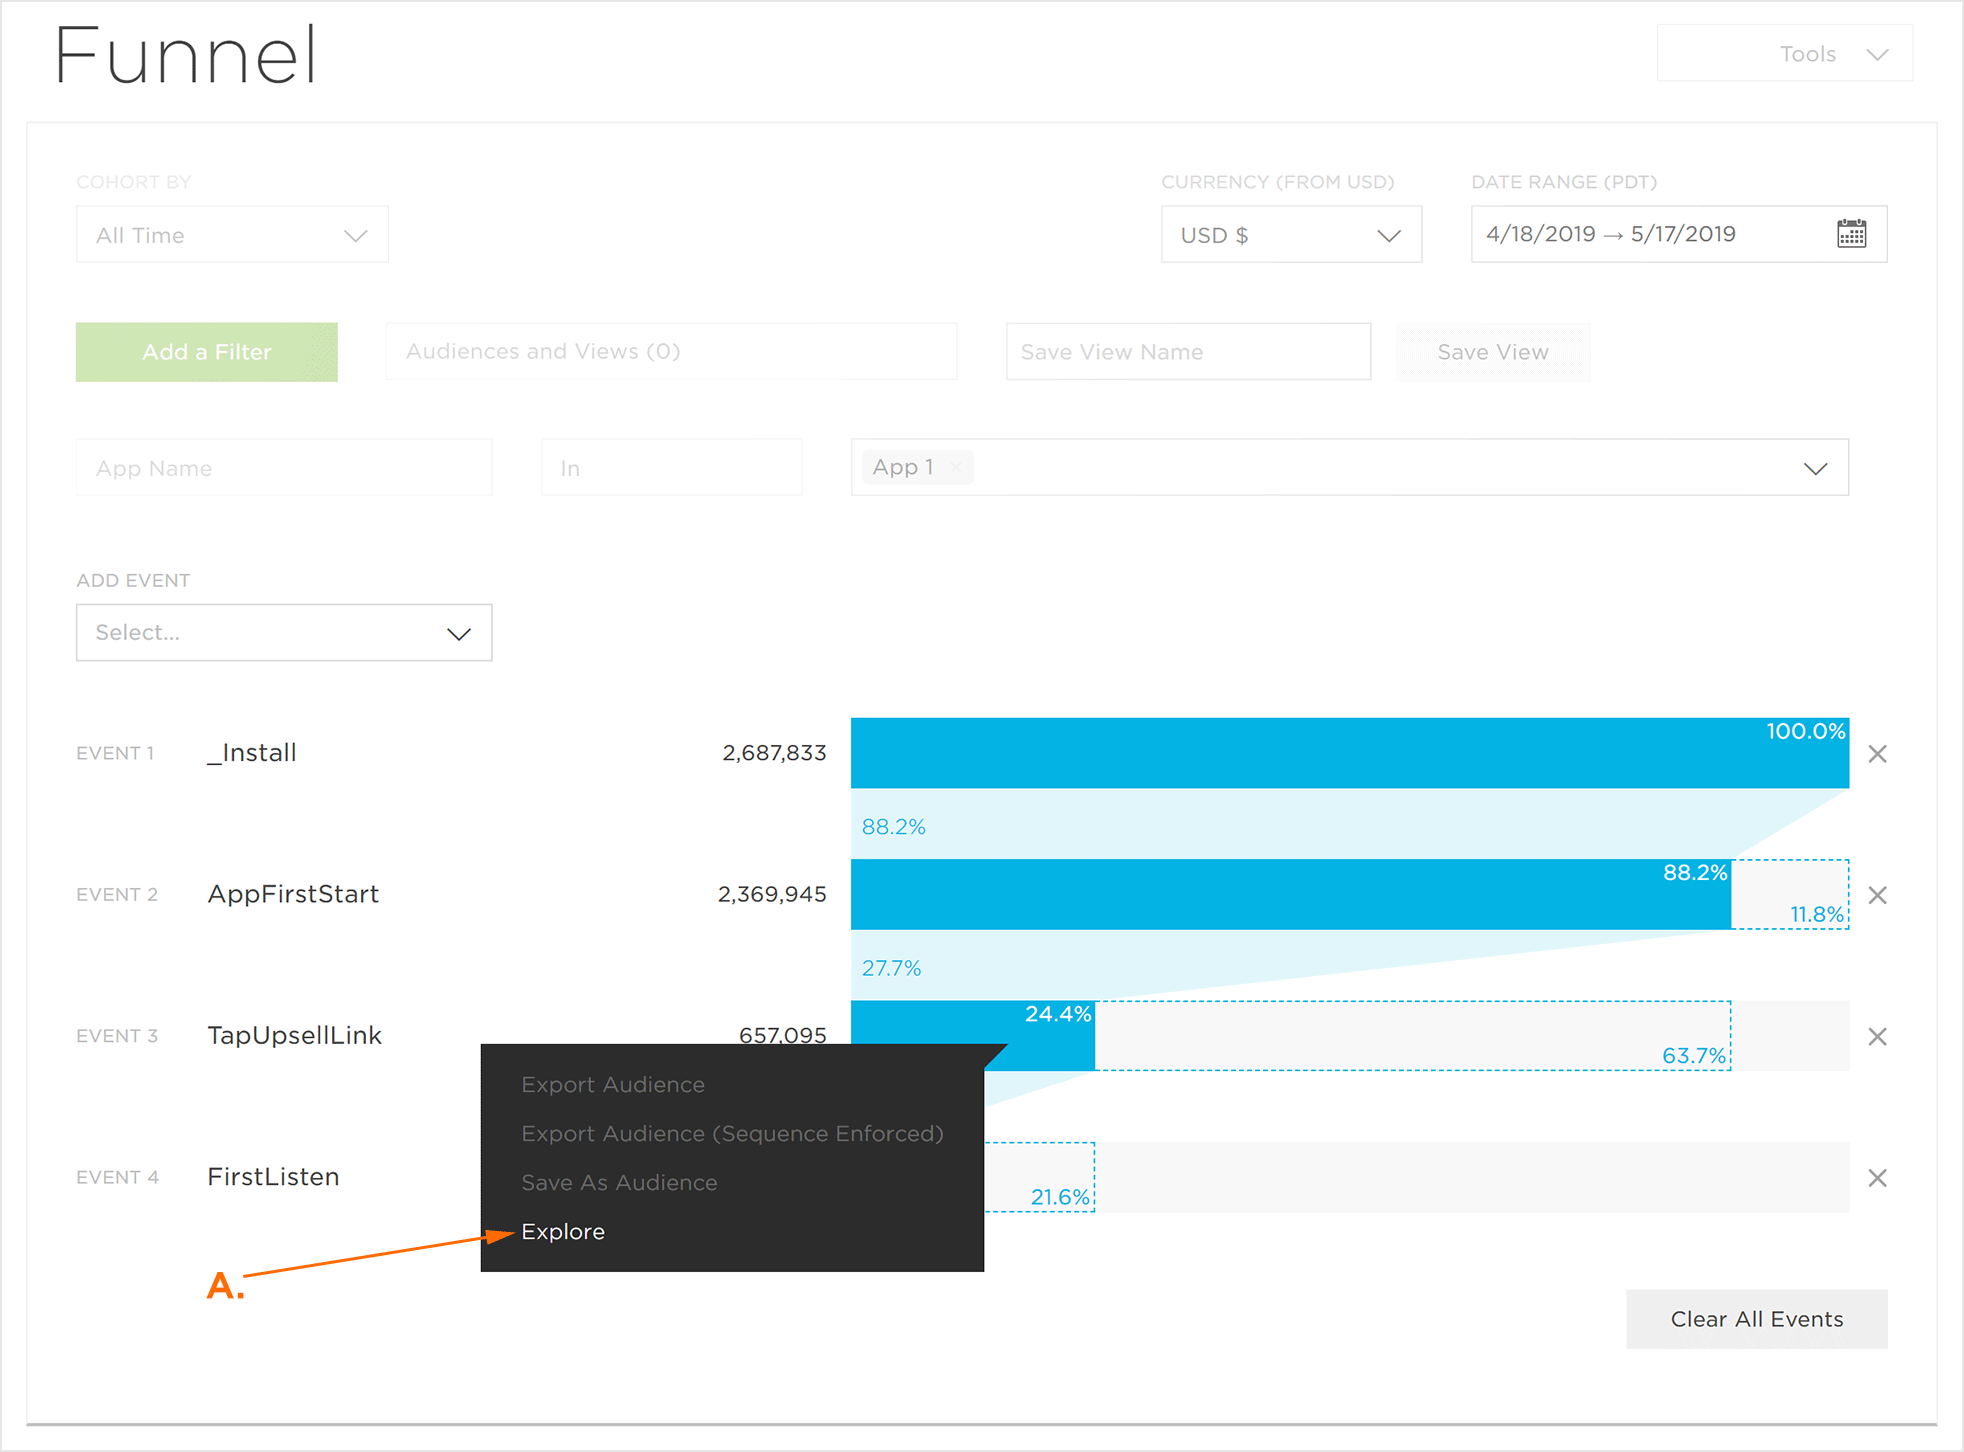
A. Click Explore to navigate to the Explorer with current Funnel settings
Exporting Audiences
The device IDs for both the users who fell within the funnel event and those that fell out of the funnel events may be exported.
NOTE: Kochava will generate a list of the device IDs and export that list in a CSV format. If multiple App data is being displayed within Analytics, a zip file will be created with each app’s device IDs listed in separate CSV files. For more information about adding additional app data to Analytics, refer to the Filters section below.
- Determine the set of Device IDs to export.
- Click on either the blue section (users who met the criteria) or the light-grey section (users who fell outside the criteria):
- Event > Devices in Funnel > Export Audience.
- Event > Lost from Funnel > Export Audience.
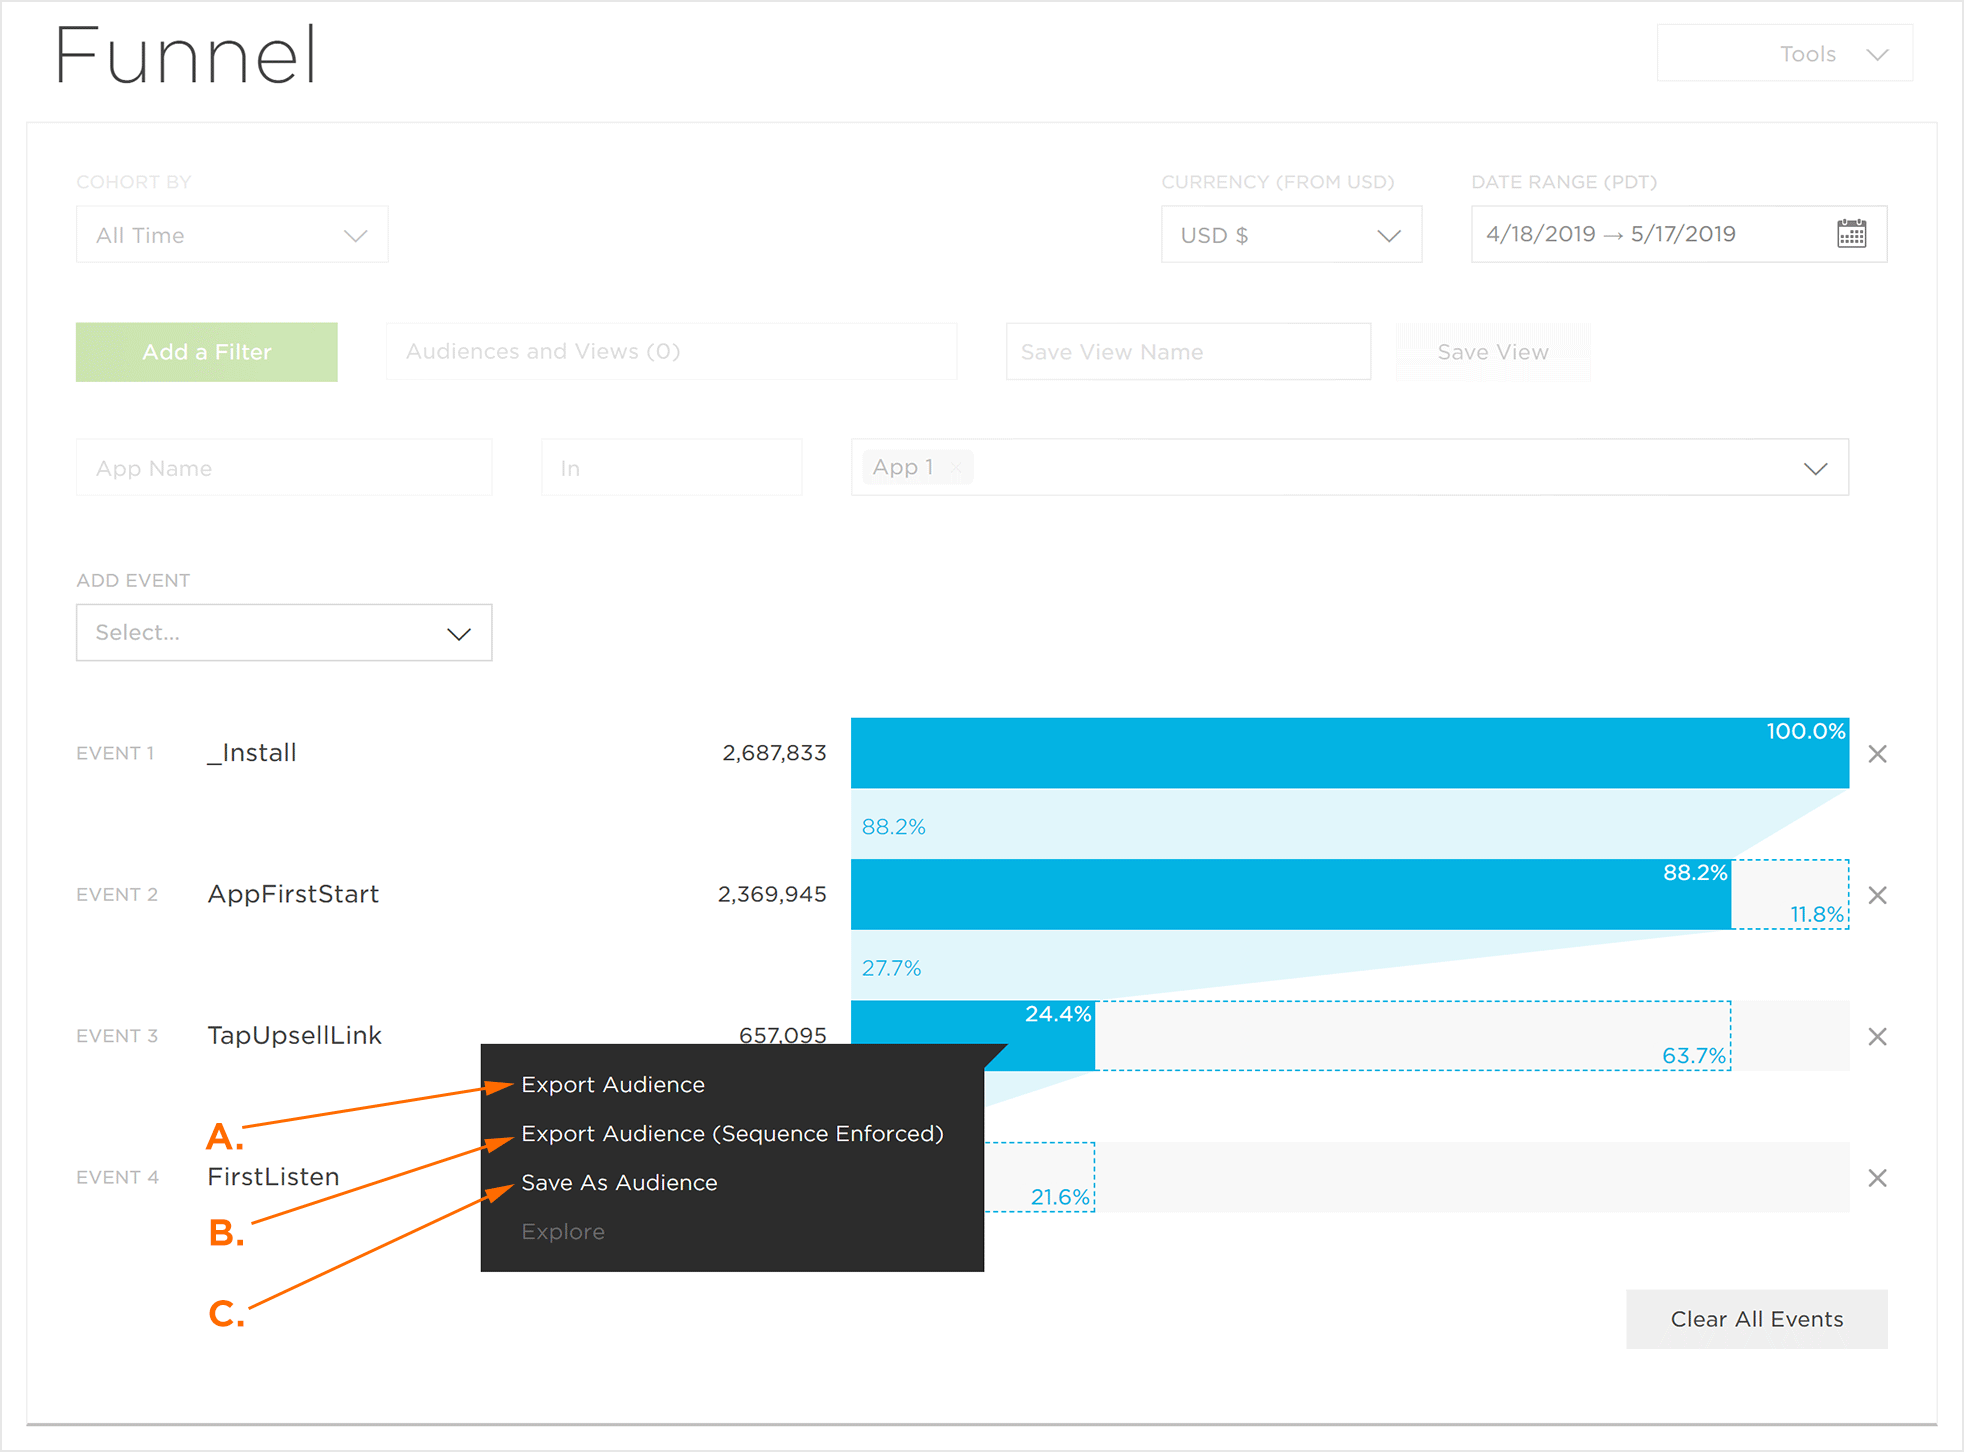
A. Click inside the funnel>Export Audience to export the devices that fell within the funnel.
B. Click inside the funnel>Export Audience (sequence enforced): Resulting device ID’s may differ from funnel view which is built using Theta sketches where event sequence order is not enforced.
C. Click inside the funnel>Save as Audience to save the audience segment to Engagement (Kochava Feature Only).
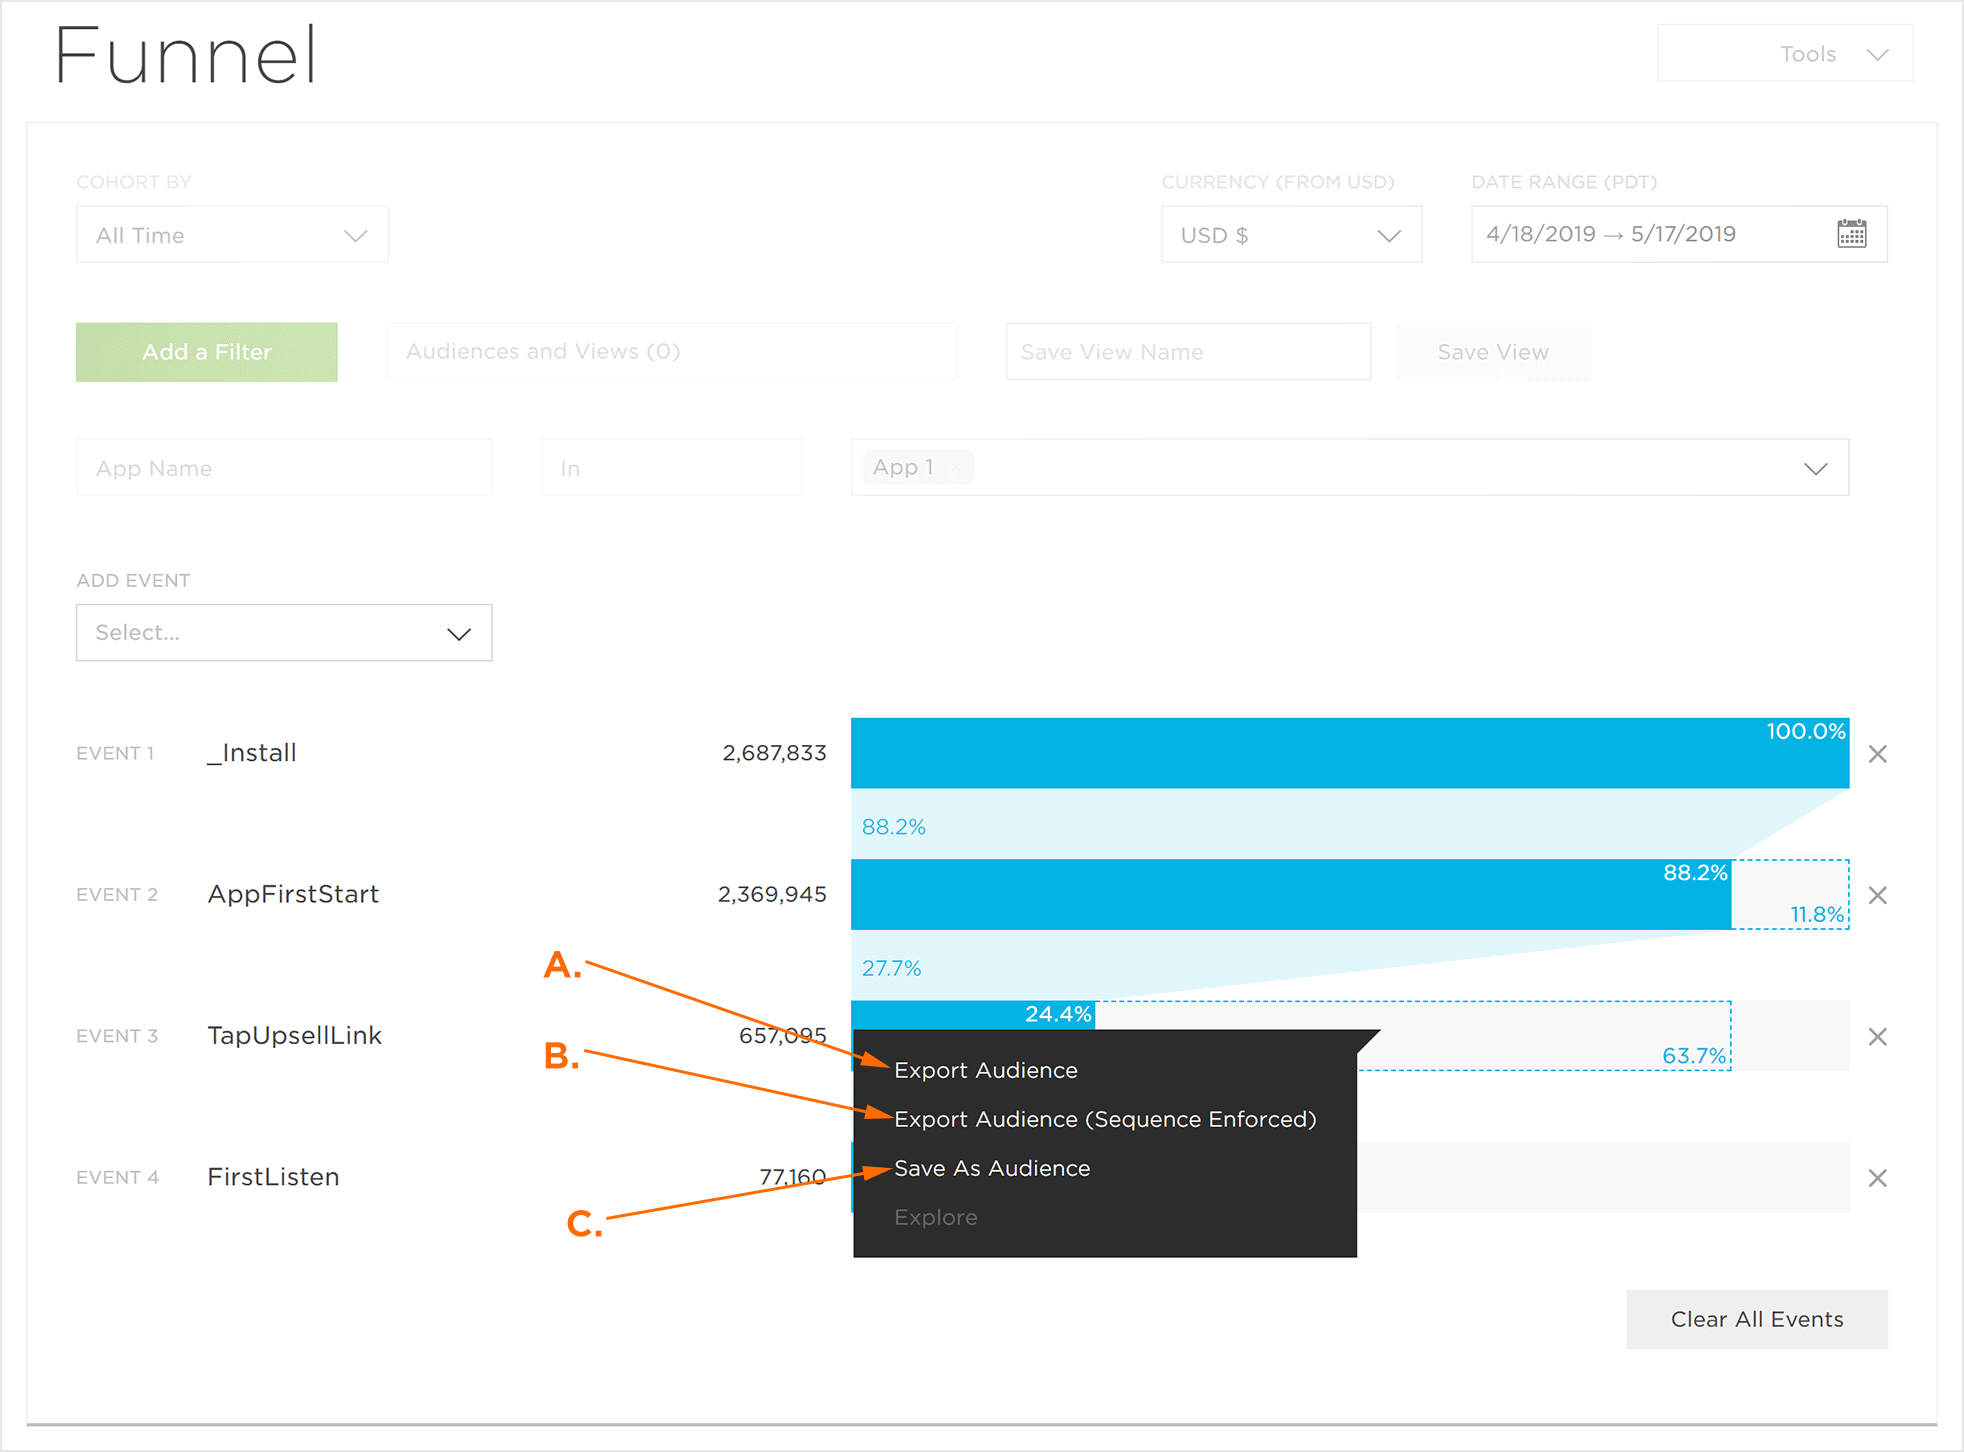
A. Click outside the funnel>Export Audience to export the devices that fell outside the funnel.
B. Click outside the funnel>Export Audience (sequence enforced): Resulting device ID’s may differ from funnel view which is built using Theta sketches where event sequence order is not enforced.
C. Click inside the funnel>Save as Audience to save the audience segment to Engagement (Kochava Feature Only).
NOTE: Once Export Device IDs has been selected, a pop-up window will appear notifying of the Device ID export, the email address which will be sent a link to the Device ID list and a button allowing the status of the export to be checked.
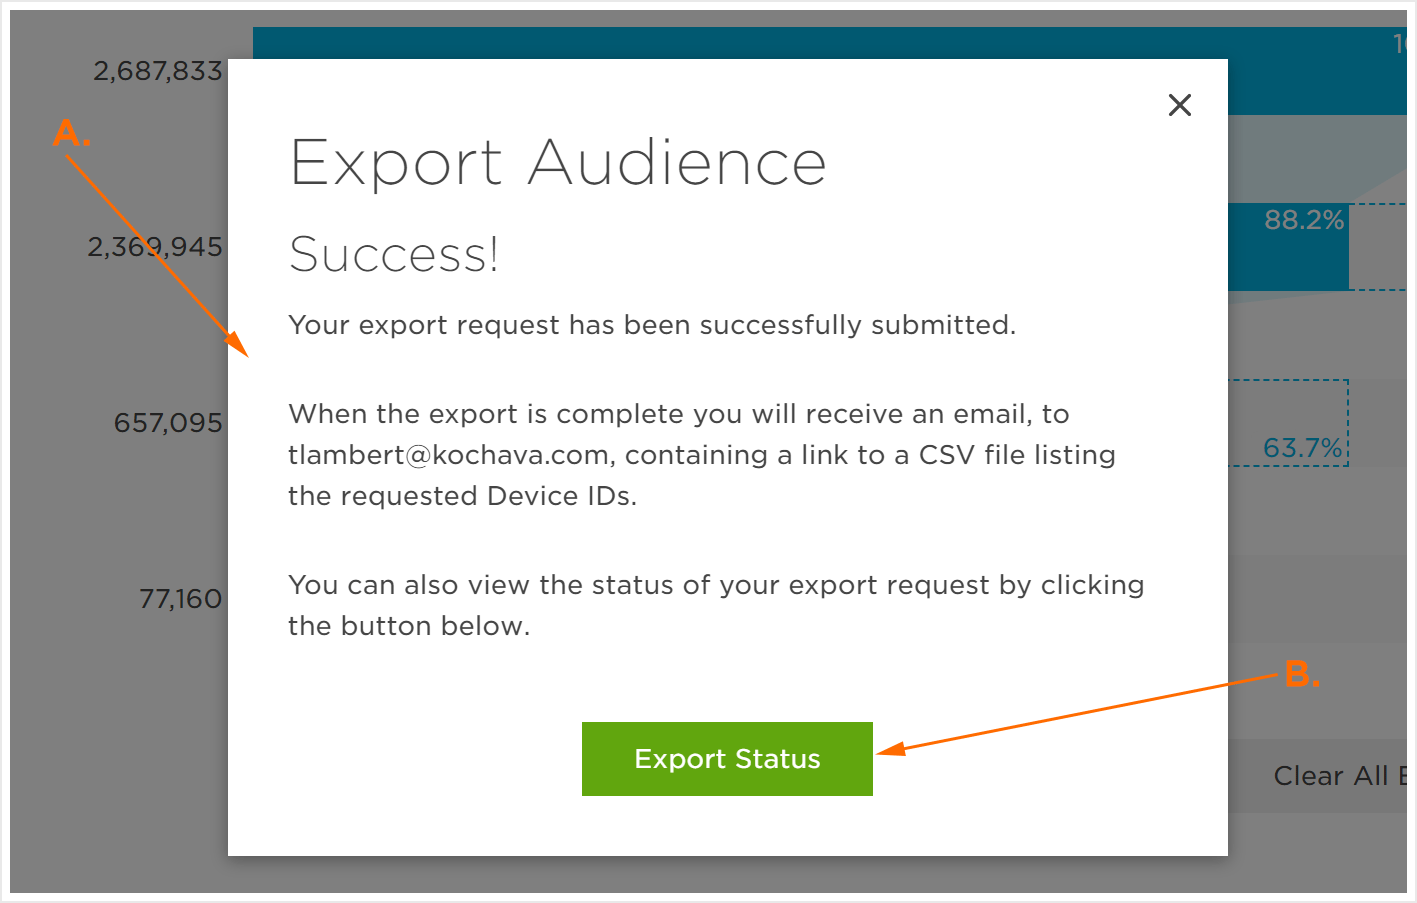
A. An email will be sent to the displayed email with a link to the CSV file containing the desired device IDs.
B. Click on View Export Status to see the status of the export.
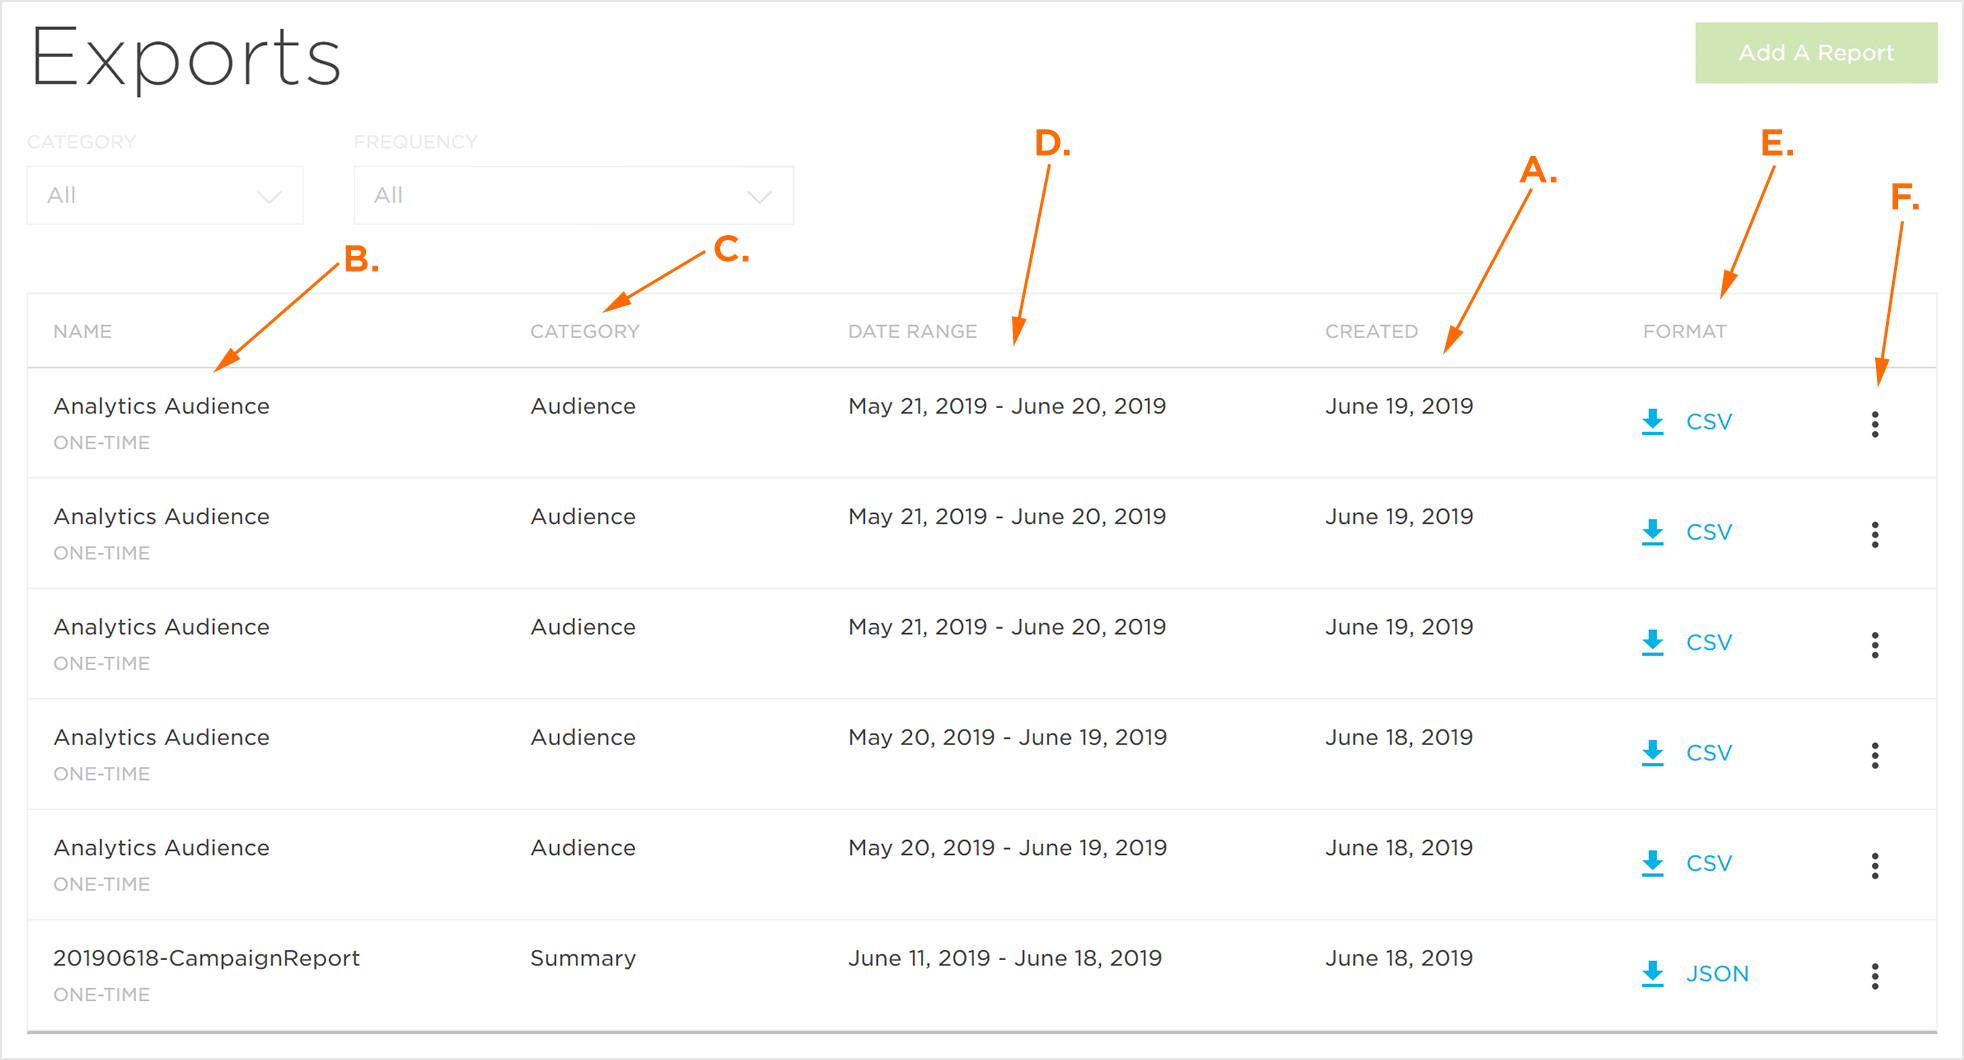
A. The date the Device ID export was submitted.
B. Filter Name that was applied during device export.
C. The Analytics page from which the export originated.
D. The status of the export.
E. When completed, the download link for Device ID export.
