The
LTV (Lifetime Value) page provides visualizations of the campaigns, devices, events, locations or attribution for the selected app. The graph may be moused over to display the data associated with each metric.
Analytics Interface
- Log in to Free App Analytics.
- Select the desired Account and App.
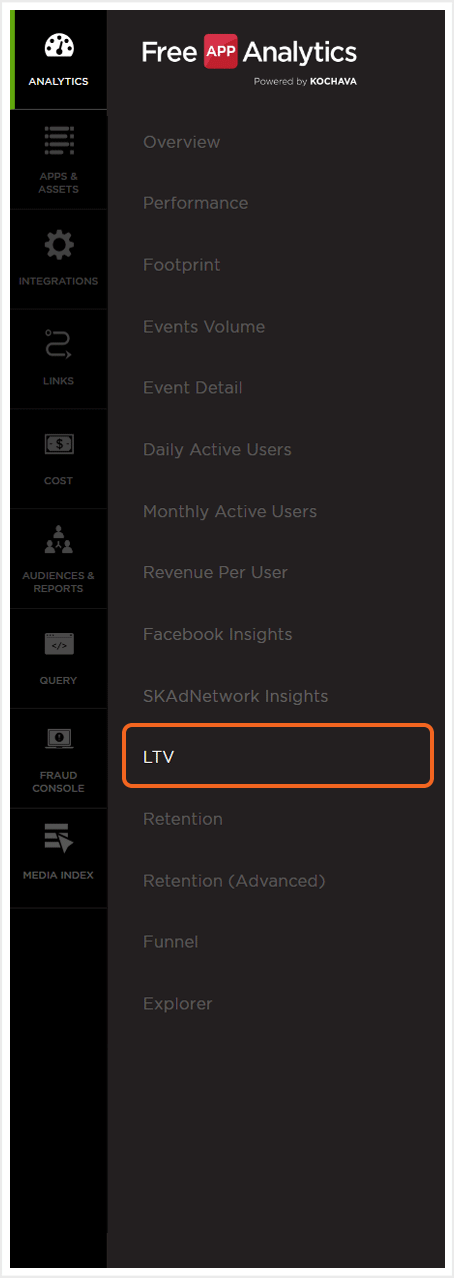
- Select Analytics > LTV.

Analytics Page Tools
For more information on the tools available for this Analytic Page such as the date field, exporting device IDs, sharing the page and applying Cohorts and filters, refer to our Analytics Page Tools support documentation.
LTV Chart Overview
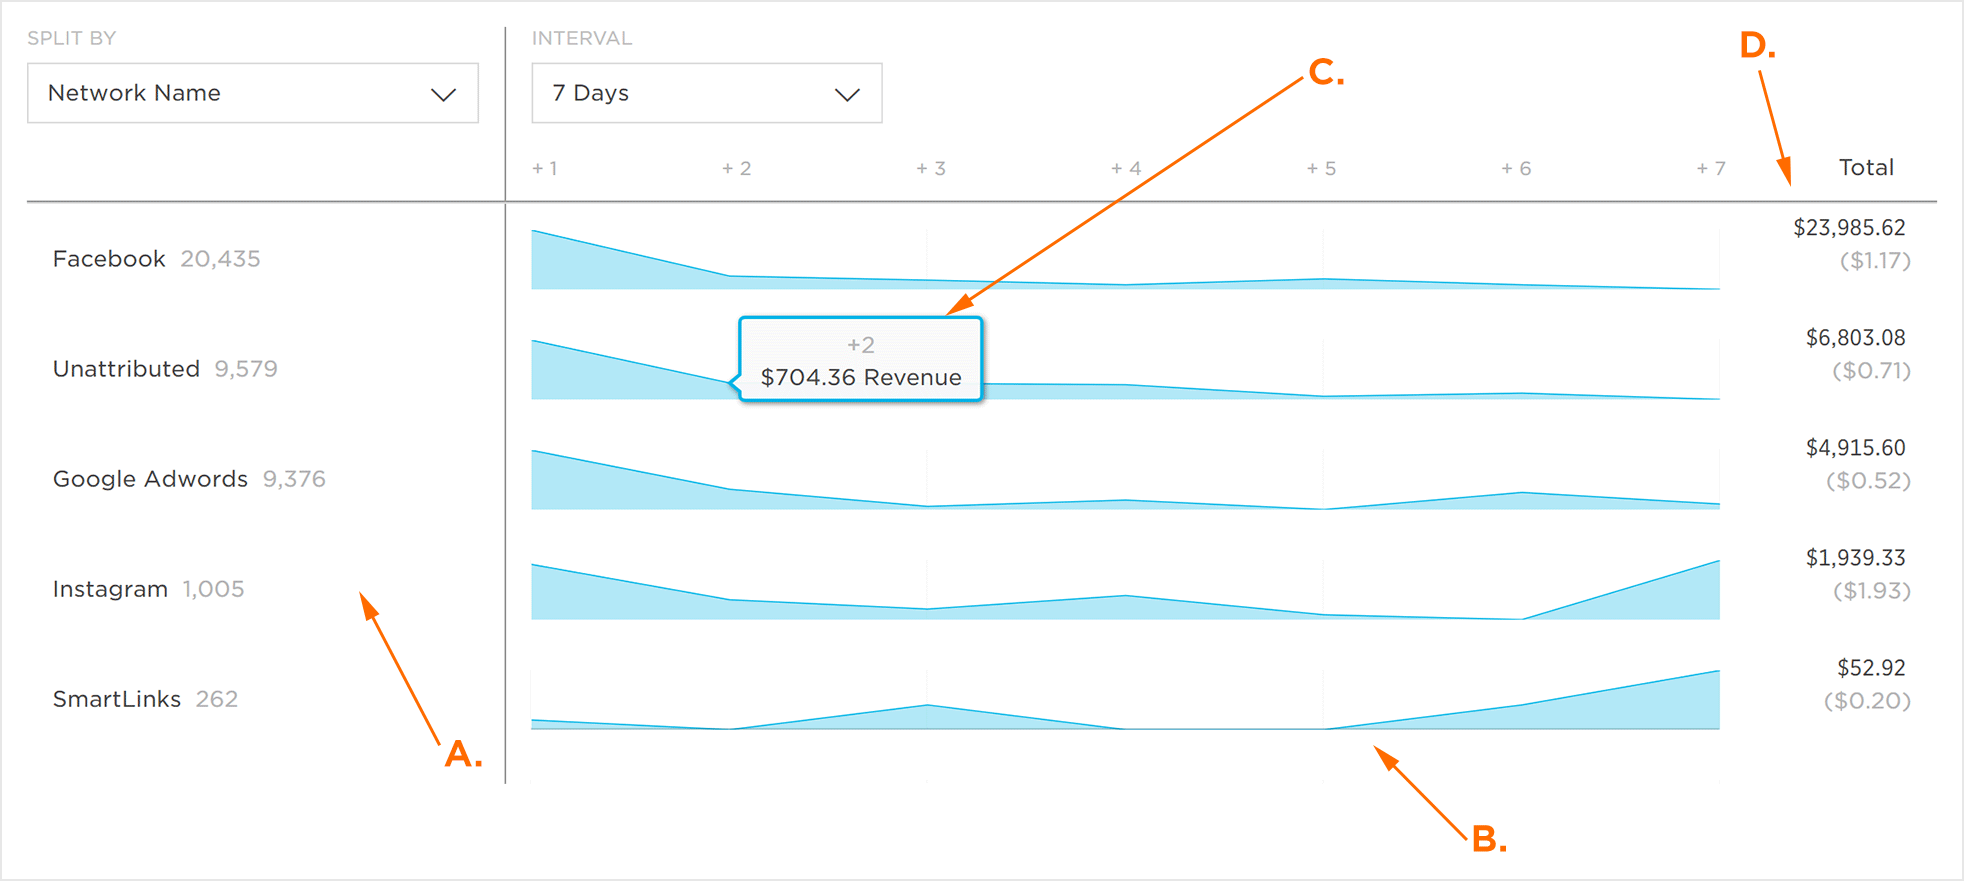
The LTV Chart is divided into three main sections the selected metrics, graphic display of the metric volume and metric totals for the selected timeframe.
Mousing over any metric within the graphical display will display the data associated with the corresponding hours/days.
NOTE: When leveraging Cross App functionality, LTV data for all apps within the App Name filter will be displayed. LTV data may be displayed for each app by utilizing the split by feature. For more information on viewing LTV data by app, refer to the Metric Organization section. For more information about adding apps using the filter feature, refer to our Analytics Page Tools support documentation.

A. Metric Names
B. Graphic Display of Metric Volume
C. Mouseover Data
D. Metric Totals
NOTE: When a metric does not have any data associated within the selected timeframe, nothing will be displayed within the graphic display and the Total will display $0.00.
Metric Organization
The metrics within the LTV page can be organized in many different ways in order to assist in the optimization of data visualization.
- From the Split By drop-down menu, Select one of the following:
- App
- App IdKochava-specific ID of the app. If selected, data will be organized under each corresponding app ID.
- App NameUser generated name of an app. If selected, data will be organized under each corresponding app name.
- App VersionUnique version name or numeric value that represents the unique state of the app. If selected, data will be organized under each corresponding app version.
NOTE: In order to use the App split by feature, the desired apps must be added utilizing the filter feature. For more information about adding apps using the filter feature, refer to our Analytics Page Tools support documentation.
- Campaign
- CampaignInstall or Post-Install - User generated Campaign Name. If selected, data will be organized under each corresponding campaign name.
- CreativeInstall or Post-Install - Typically an image or video, Kochava receives the creative ID upon install or event. If selected, data will be organized under the corresponding creative ID.
- SegmentInstall or Post-Install - User generated name for a group within a campaign. If selected, data will be organized under each corresponding segment name.
- TrackerInstall or Post-Install - User generated name for a tracker within a segment and campaign. If selected, data will be organized under each corresponding tacker name.
- Device
- Device Carrier NameInstall or Post-Install - The cellular service provider (e.g., Verizon, AT&T). If selected, data will be organized under each corresponding carrier name.
- Device LanguageInstall or Post-Install - The primary language set for the device. If selected, data will be organized under each corresponding language code (e.g., en-US, zh-CN).
- Device Network Conn TypeInstall or Post-Install - The device connection type (e.g., WIFI, Cellular). If selected, data will be organized under each corresponding network connection type.
- Device OrientationInstall or Post-Install - The physical orientation of the device with respect to gravity (e.g, Landscape, Portrait). If selected, data will be organized under each device orientation.
- Device OsInstall or Post-Install - The mobile operating system that is installed on the device (e.g., iOS, Android). If selected, data will be organized under each corresponding operating system.
- Device Os VersionInstall or Post-Install - The unique version number for the operating system (e.g., iOS-10.3.3, Android-8.0.0). If selected, data will be organized under each corresponding operating system version.
- Device TypeInstall or Post-Install - The description of the device that install or post-install event is attributed to (e.g., SM-G935V-Verizon, iPhone8,1). If selected, data will be organized under each corresponding device type.
- Device VersionInstall or Post-Install - The device hardware version (e.g., iPhone-iOS-11.3, Samsung SM-N950U-Android-7.1.1). If selected, data will be organized under each corresponding device version.
- Events
NOTE: The post-install events that are available within this section of the Split By menu are determined by the events setup for tracking. For more information about creating and configuring events, refer to our Post-Install Event Creation and Configuration support documentation.
- Location
- CityInstall or Post-Install - The name of the city where the click, install or post-install event occurred. If selected, data will be organized under each corresponding city.
- CountryInstall or Post-Install - The 2 digit country designation where the click, install or post-install event occurred. If selected, data will be organized under each country.
- DMAInstall or Post-Install - The designated marketing area where the click, install or post-install event occurred. If selected, data will be organized under each corresponding dma.
- RegionInstall or Post-Install - The 2 digit region designation where the click, install or post-install event occurred. If selected, data will be organized under each region.
- ZipInstall or Post-Install - An alpha numeric representation of the particular postal area where the click, install or post-install event occurred. If selected, data will be organized under each corresponding ZIP code.
- Attribution
(see iOS 14+ restrictions)
- TypeInstall - The type of attribution (e.g., Unattributed, Install). If selected, data will be organized under each corresponding attribution type.
- Install CampaignInstall - The install campaigns associated with the app. If selected, data will be organized under each corresponding install campaign.
- Install CreativeInstall - The creative associated with install. If selected, data will be organized under each corresponding install creative.
- Install Matched ByInstall - The device ID type by which the install was matched (e.g., idfa, ip, probabilistic). If selected, data will be organized under each corresponding install match type.
- Install Network NameInstall - The name of the newtork to which the install was attributed. If selected, data will be organized under each corresponding network name.
- Install SiteInstall - The site to which the install was attributed within the publisher partner. If selected, data will be organized under each corresponding site.
- Install TrackerInstall - The tracker name to which the install is attributed. If selected, data will be organized under each corresponding tracker name.
- Matched ToInstall - The identifier to which attribution was matched (e.g., idfa, iad, adid). If selected, data will be organized under each attribution identifier.
- Matched ByInstalls and Post-Install - The method to which attribution was matched (e.g., click, impression, unattributed). If selected, data will be organized under each corresponding attribution method.
- Network NameInstall Post-Install - The name of the network to which attribution was awarded. If selected, data will be organized under each corresponding network name.
- Network IdInstall or Post-Install - The Kochava-specific ID of the network to which attribution was awarded. If selected, data will be organized under each corresponding network ID.
- Network Key
- Partner Ad Group IDInstall or Post-Install - The Kochava-specific ID of the ad group to which attribution was awarded. If selected, data will be organized under each corresponding ad group ID.
- Partner Ad Group NameInstall or Post-Install - The name of the ad group to which attribution was awarded. If selected, data will be organized under each corresponding ad group name.
- Partner Campaign IdInstall or Post-Install - The unique numeric identification for the partner campaign. If selected, data will be organized under each corresponding partner campaign ID.
- Partner Campaign NameInstall or Post-Install - The name of the partner campaign to which attribution was awarded. If selected, data will be organized under each partner campaign name.
- Partner KeywordInstall or Post-Install - The partner keyword for the campaign which was awarded attribution. If selected, data will be organized under each corresponding keyword.
- Partner PlatformInstall or Post-Install - The name of the partner digital platform to which attribution was awarded (e.g., facebook, display, messenger). If selected, data will be organized under each corresponding platform.
NOTE: For more information about how the Partner fields map to SAN metadata, please refer to our SAN Networks Campaign Data Mapping support documentation.
- QR CodeInstall - A boolean value (true, false) indicating if the installed was attributed to a QR Code. If selected, data will be organized under the boolean category.
- SiteInstall or Post-Install - The site to which the install or post-install event is attributed to (e.g., 3054, Facebook). If selected, data will be organized under each corresponsind site.
- Agency
- Agency NameInstall or Post-Install - The name of the agency to which the install or post-install event is attributed (e.g., MediaMath, AdParlor). If selected, data will be organized under each corresponding agency name.
- Agency IdInstall or Post-Install - The Kochava-specific agency ID to which the install or post-install event was attributed (e.g., 6702, 8577). If selected, data will be organized under each corresponding agency ID.
- Traffic Verification
- Traffic Verification Fail ReasonInstall or Post-Install - The traffic verifier metric which did not meet the defined condition and value (e.g., country, platform). If selected, data will be organized under each traffic verification fail reason.
- Traffic VerifiedInstall or Post-Install - Inidication whether the traffic has been verified or not. 1 indicates the traffic is verified, 0 indicates it was not verified. If selected, data will be organized under the traffic verified category.
Organize by Interval
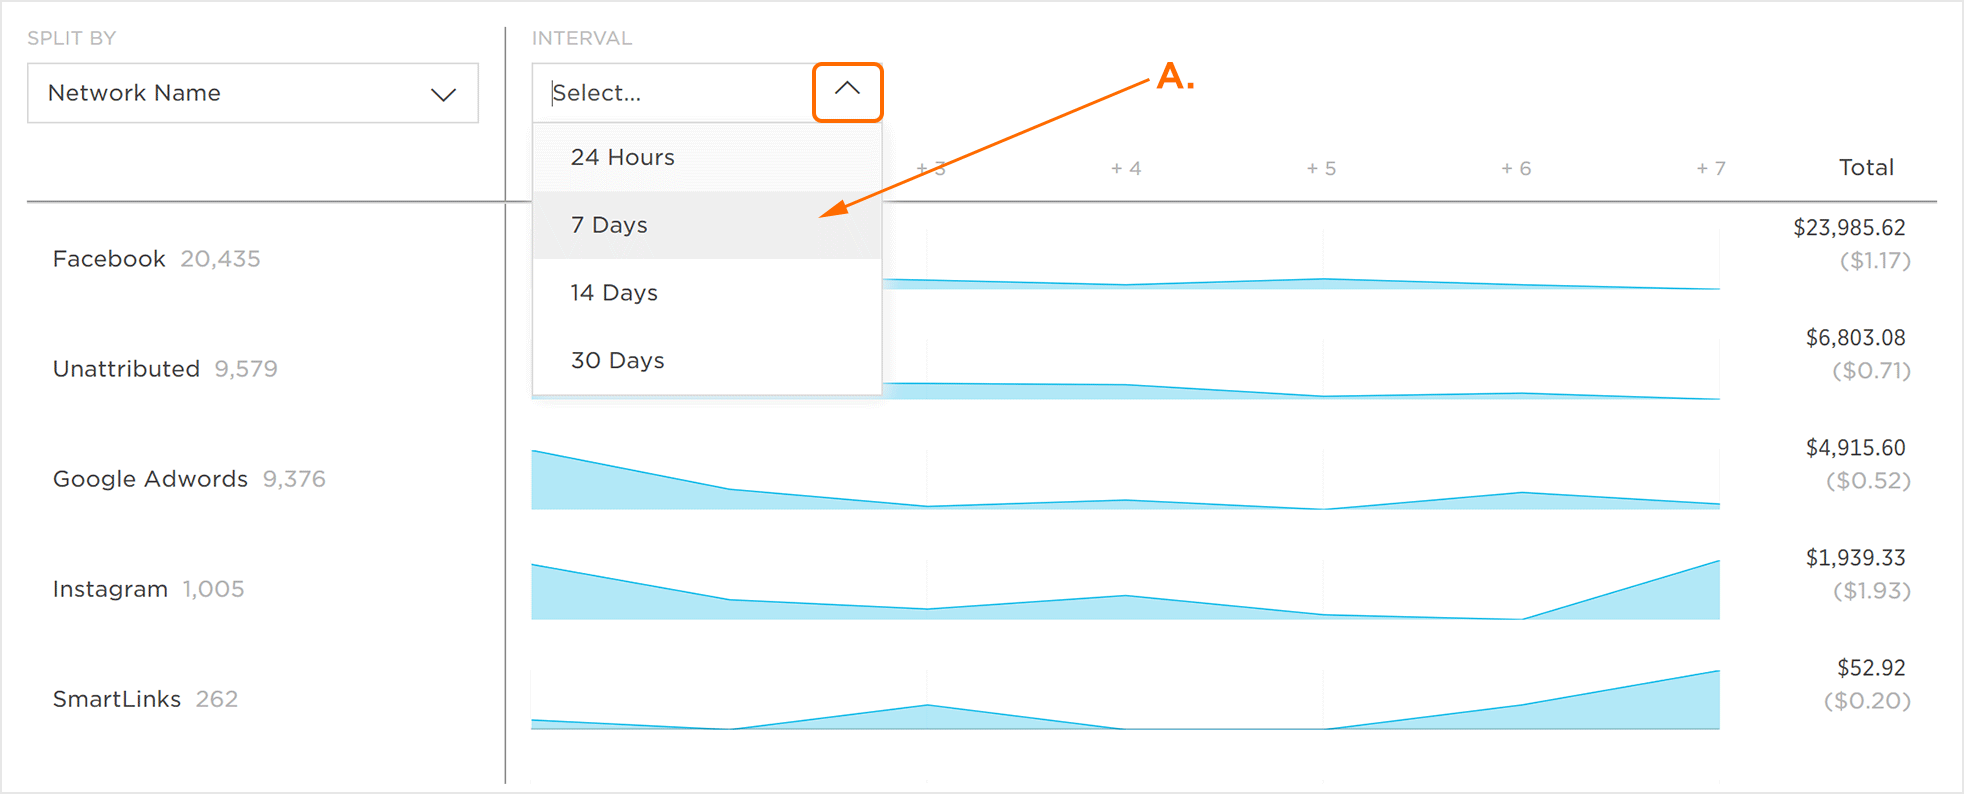
Intervals within the metric graphic display can be organized to display specific windows of time.
- From the Interval drop-down menu, Select one of the following:
- 24 Hours
- 7 Days
- 14 Days
- 30 Days

A. Interval from 24 Hours to 30 Days
Last Modified: Nov 10, 2022 at 4:58 pm
