This feature is available only with paid Kochava accounts. Contact us to learn more.
Kochava Cost provides access to daily spend reports across all of your (Kochava Cost-integrated) network partners, all in one place. Once a configuration has been established with an API-connected partner (or a Manual Upload partner), Kochava Cost records and displays the daily spend in an easy-to-consume graphical representation – so your team can get a quick view of the overall Cost across apps, platforms, partners or campaigns.
- Filter by partner or campaign.
- Enable/Disable visualization metrics with one click.
- Adjust the date range to customize the view.
- Display totals for partner-reported Spend, Impressions, Cost Per Mille (CPM), Clicks, Cost Per Click (CPC), Installs, and Cost per Install (CPI).
Cost Overview Interface
- Log in to Free App Analytics.
- Select the desired Account and App.
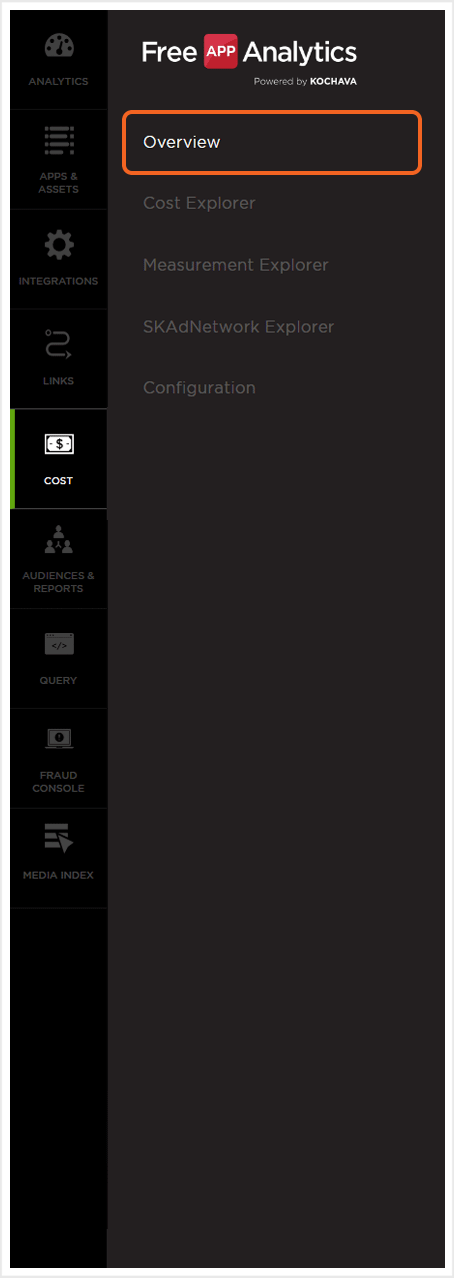
- Select Cost > Cost Overview.

Filtering Cost Data
The Cost Overview page provides useful tools designed to display the cost data that is most relevant.
By default, cost data for all apps are displayed when the page is initially loaded. The data that is being display may be filtered to display only the cost data associated with specific apps.
- Click on the “+” and select an app.
- Select any additional apps.
NOTE: Once an app has been selected, only the cost data associated with that app will be displayed. Multiple apps may be added.
NOTE: Apps may be removed by clicking on the associated “X“. Cost data will be automatically updated based on the apps selected.
By default, cost data for all platforms is displayed when the page is initially loaded. The data that is being display may be filtered to display only the cost data associated with a specific platform.
- From the Platform drop-down menu select one of the following:
- All
- Android
- Android Instant App
- Android TV
- Chromecast
- Daydream
- Fire OS
- HTC Vive
- iOS
- iOS App Clip
- LGWebOS
- Linux
- macOS
- Nintendo Switch
- Nintendo WiiU
- Oculus GO
- Oculus Rift
- Playstation
- Roku
- Samsung Gear VR
- Tizen OS
- tvOS
- Vizio Smartcst OS
- Web
- WebGL
- Windows
- Windows Xbox
NOTE: Once a platform has been selected, only the cost data associated with that platform will be displayed.
By default cost data is displayed in US Dollars, however cost data may be displayed in a variety of other currency.
- From the Currency drop-down menu select one of the following:
- AED
- AFN
- ALL
- AMD
- ANG
- AOA
- ARS
- AUD
- iOS
- AWG
- AZN
- BAM
- BBD
- BDT
- BGN
- BHD
- BIF
- BMD
- BND
- BOB
- BRL
- BSD
- BTC
- BTN
- BWP
- BYN
- BYR
- BZD
- CAD
- CDF
- CHF
- CLF
- CLP
- CNH
- CNY
- COP
- CRC
- CUC
- CUP
- CVE
- CZK
- DJF
- DKK
- DOP
- DZD
- EEK
- EGP
- ERN
- ETB
- EUR
- FJD
- FKP
- GBP
- GEL
- GGP
- GHS
- GIP
- GMD
- GNF
- GTQ
- GYD
- HKD
- HNL
- HRK
- HTG
- HUF
- IDR
- ILS
- IMP
- INR
- IQD
- IRR
- ISK
- JEP
- JMD
- JOD
- JPY
- KES
- KGS
- KHR
- KMF
- KPW
- KRW
- KWD
- KYD
- KZT
- LAK
- LBP
- LKR
- LRD
- LSL
- LTL
- LVL
- LYD
- MAD
- MDL
- MGA
- MKD
- MMK
- MNT
- MOP
- MRO
- MRU
- MTL
- MUR
- MVR
- MWK
- MXN
- MYR
- MZN
- NAD
- NGN
- NIO
- NOK
- NPR
- NZD
- OMR
- PAB
- PEN
- PGK
- PHP
- PKR
- PLN
- PYG
- QAR
- RON
- RSD
- RUB
- RWF
- SAR
- SBD
- SCR
- SDG
- SEK
- SGD
- SHP
- SLL
- SOS
- SRD
- SSP
- STD
- STN
- SVC
- SYP
- SZL
- THB
- TJS
- TMT
- TND
- TOP
- TRY
- TTD
- TWD
- TZS
- UAH
- UGX
- USD
- UYU
- UZS
- VEF
- VES
- VND
- VUV
- WST
- XAF
- XAG
- XAU
- XCD
- XDR
- XOF
- XPD
- XPF
- XPT
- YER
- ZAR
- ZMK
- ZMW
- ZWL
By default, cost data for all media partners is displayed when the page is initially loaded. The data that is being display may be filtered to display only the cost data associated with specific media partners.
- Click on the “+” and select a media partner.
- Select any additional media partners.
NOTE: Once a media partner has been selected, only the cost data associated with that media partner will be displayed. Multiple media partners may be added.
NOTE: Media partners may be removed by clicking on the associated “X“. Cost data will be automatically updated based on the media partners selected.
Cost data may also be filtered by specific campaigns.
- Click on the “+” and select a campaign name.
- Select any additional campaign names.
NOTE: Only the campaigns that are associated with the selected media partners will be available.
NOTE: Campaigns may be removed by clicking on the associated “X“. Cost data will be automatically updated based on the campaigns selected.
Cost Date Range:
Cost data may be filtered by date range. By default, the data displayed is set to cover the previous 30 days.
The following options are available for date range selection:
- Today — The current day from 12:00 a.m. to 11:59:59 p.m.
- Yesterday — The last full day from 12:00 a.m. to 11:59:59 p.m.
- Week-to-date — From Monday to the current time of the current week.
- Last week — From Monday to Sunday of the last completed week.
- Last 7 days — The last 7 days up to the current time of the current day.
- Month-to-date — From the first day of the current month to the current time of the current day.
- Last month — All days within the previous month.
- Last 30 days — The last 30 days including the current day.
- Custom — Based upon selection.
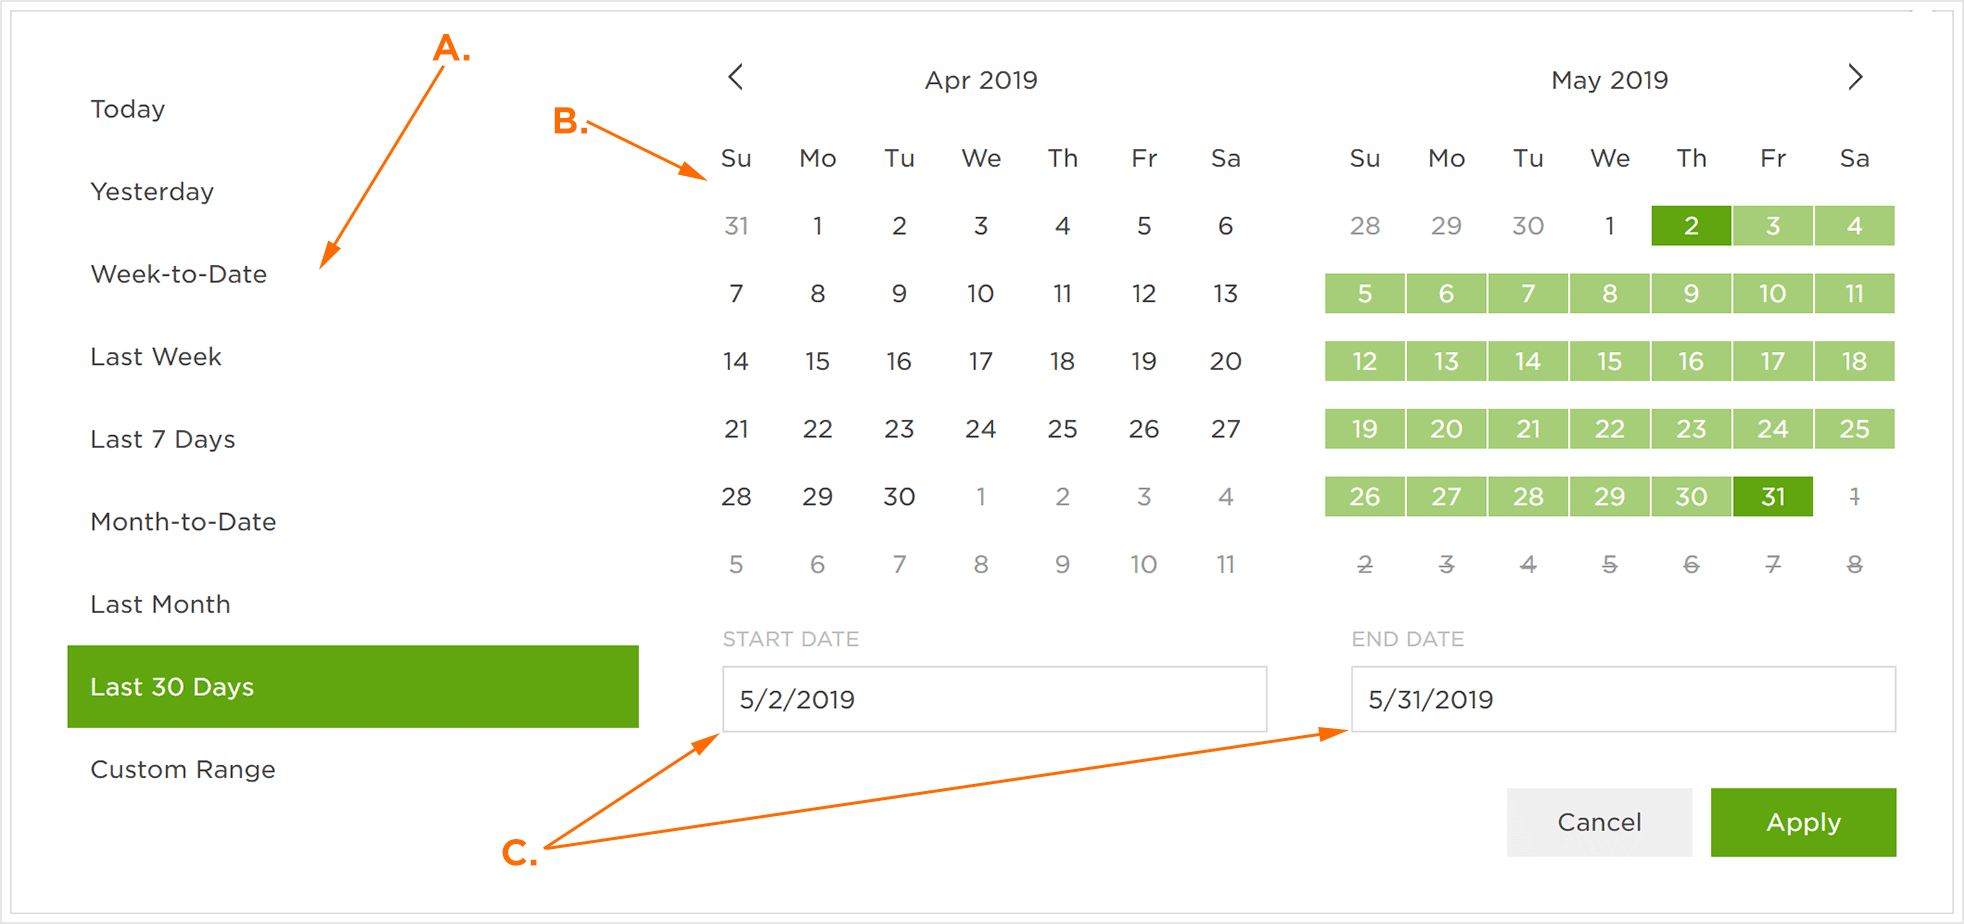
The date range can be adjusted by selecting one of the predefined selections, clicking on the desired dates within the calendar or manually entering the desired date range into the provided date fields.

A. Preset date ranges, click to activate
B. Indicates selected data range, can be adjusted by clicking on desired dates
C. Indicates selected date range, can be adjusted by manually entering dates
Cost Overview Chart
The Cost Overview chart is divided into two main sections. The first section is a numeric display of the Total Spend, Impressions, CPM, Clicks, CPC, Installs and CPI. The second section the interactive Cost chart.
Numeric Display:
The numeric display provides a quick reference for the latest cost data for the following:
- Total Spend — The total amount of money spent within the selected time frame in USD.
- Impressions — The total number of impressions associated with the selected cost campaign(s).
- CPM — The cost per thousand impressions.
- Clicks — The total number of clicks associated with the selected cost campaign(s).
- CPC — The cost per click.
- Installs — The total number of installs associated with the selected cost campaign(s).
- CPI — The cost per install.

Graphic Display:
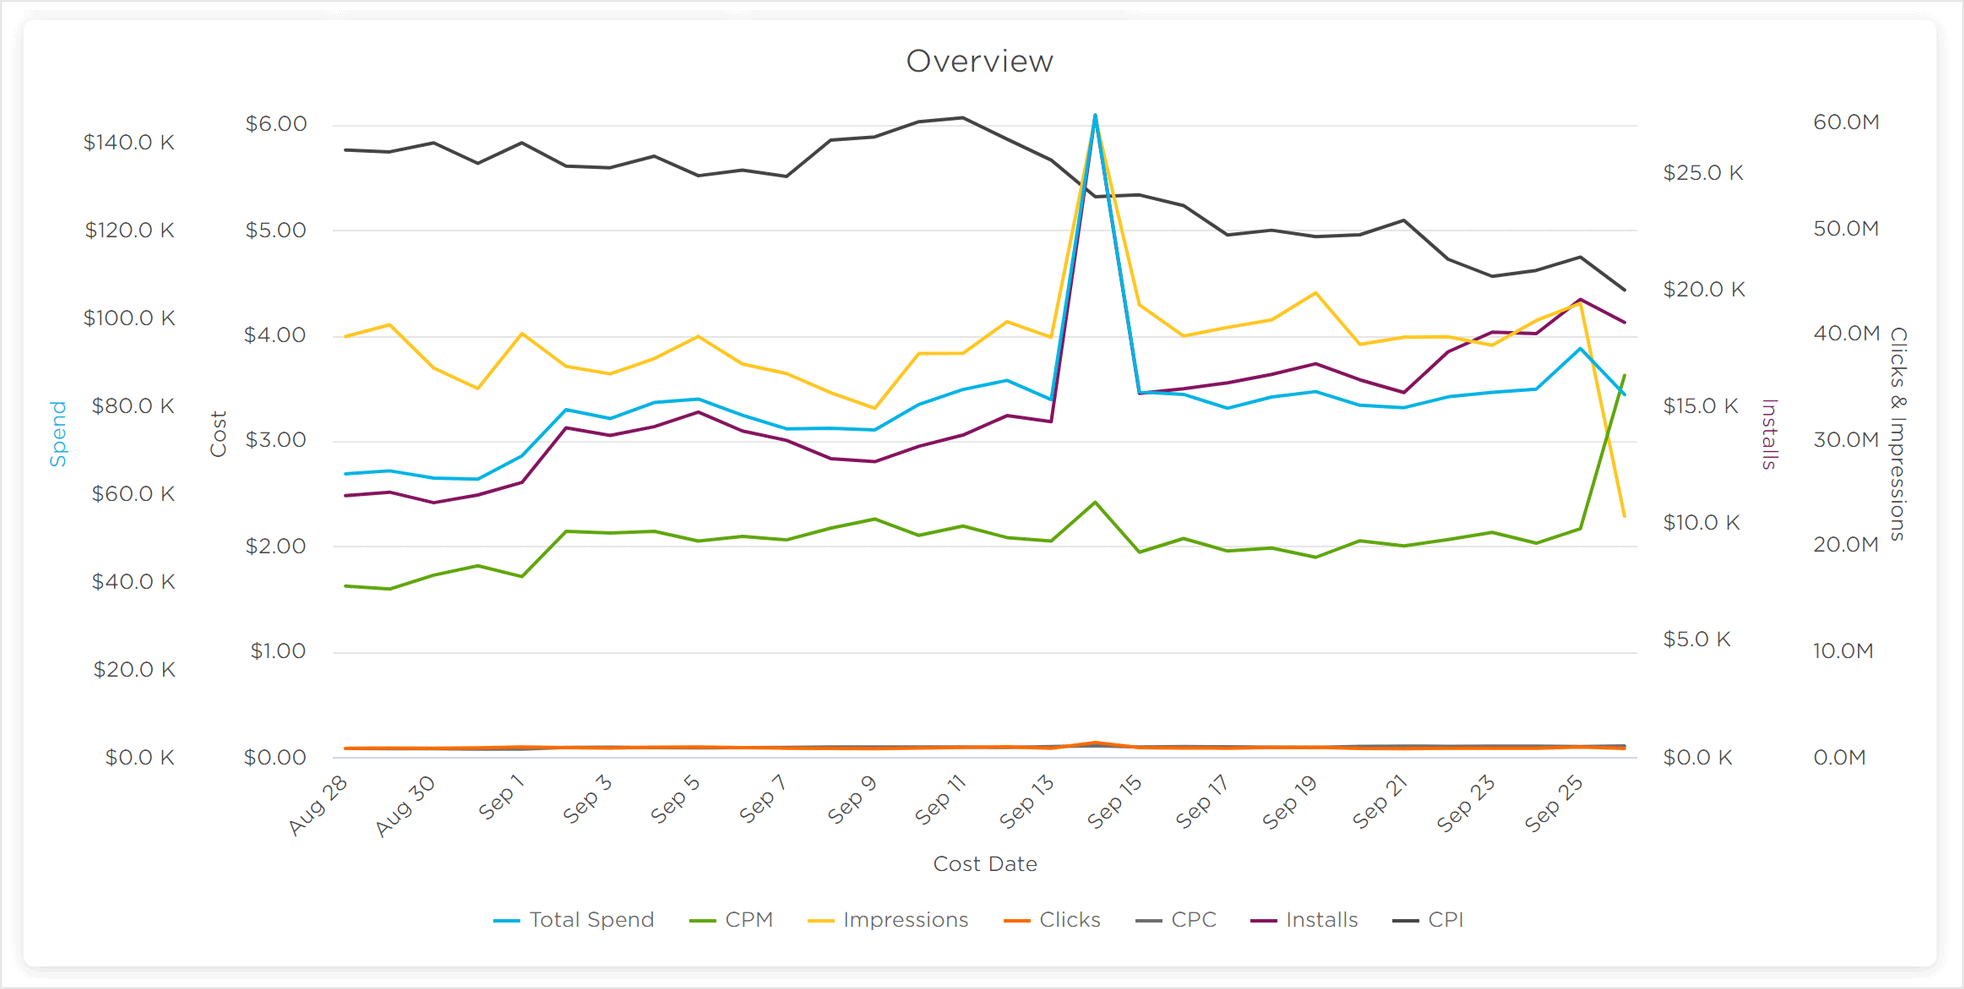
The graphic display provides a visual overview of the spend, cost, installs, clicks and impressions over the selected time frame. Spend, cost, installs as well as clicks and impressions are represented on the vertical axis while the horizontal axis is the selected time frame.
NOTE: Legend items maybe enabled/disabled by clicking on them in order to provide better visibility or more detail.

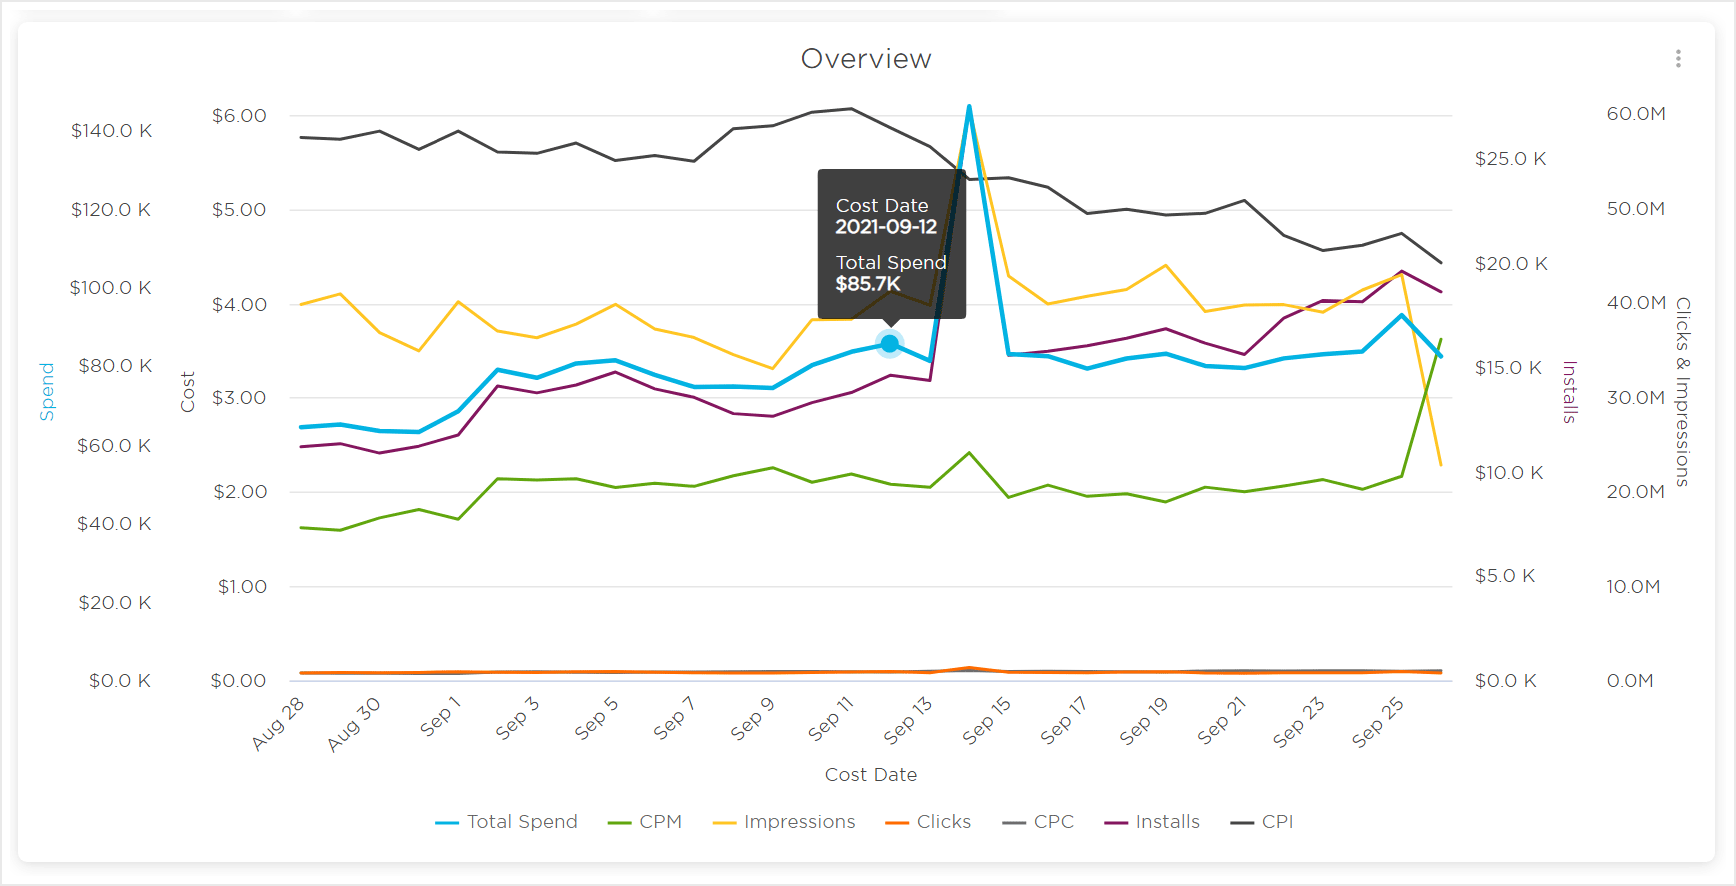
Mousing over any part of the interactive chart will display the corresponding data for each metric (Total Spend, CPM, Impressions, Clicks, CPC, Installs, CPI) for the corresponding date within the time frame. Moving the cursor along the horizontal axis will display the data for any of the dates within the selected time frame.

Individual days may may be viewed by clicking on any of the metrics for that day. Multiple days worth of cost data may also be displayed by clicking and dragging over the desired date range. Once either a single day or multiple days have been selected, the data represented in the Numeric Display will be updated.

